October 21, 2024

Mastering Enterprise Network Complexity with Advanced Visualization Techniques

Written by: Manvendra Singh
|
Key Takeaways
|
|
The landscape of enterprise networking has undergone tremendous change in recent years. Widespread adoption of software-defined networking (SDN), the proliferation of multi-cloud environments, the rise of edge computing, and the implementation of zero-trust security models have collectively reshaped network architectures. While these trends bring unprecedented flexibility and scalability, they have also exponentially increased complexity.
As a result, network administrators grapple with the paradox that the very innovations that empower their networks also obscure them. The loss of clear visibility into network topologies has become a critical challenge, with network teams struggling to maintain a coherent understanding of their increasingly abstract and fluid infrastructures. When attempting to visualize and manage expansive network infrastructures, the sheer volume of nodes, connections, and interdependencies in modern enterprise networks often overwhelms traditional visualization tools, leading to reduced visibility, slower problem resolution, and potential security vulnerabilities. In this context, the need for sophisticated, meaningful topological visualization has never been more urgent.
One of the primary challenges in large-scale network topology visualization is the ability to present vast amounts of data in a meaningful and actionable way. Advanced visualization tools should represent modern networks' multi-layered, dynamic nature in an intuitive and actionable manner. It must go beyond static diagrams, offering real-time, interactive views that can adapt to the constant flux of software-defined environments. This blog explores advanced visualization techniques that transform complex network structures into comprehensible, actionable visual representations.
Mastering complexity using grouping in network visualization
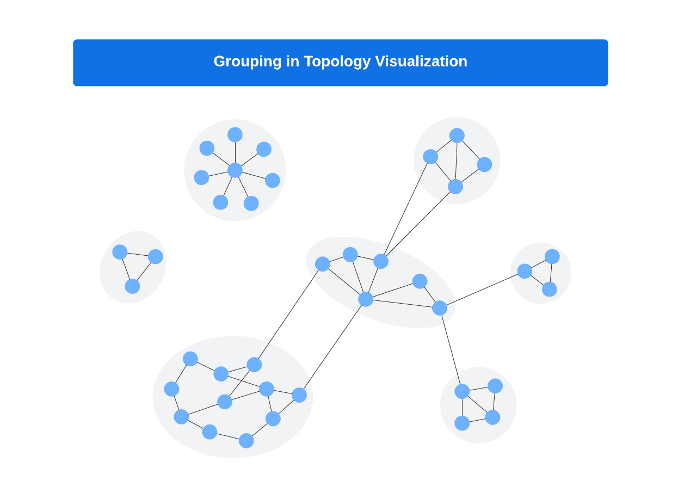
Mastering enterprise networks requires perceiving overarching designs from granular endpoints; this is where grouping in network topology visualization becomes invaluable. Administrators can transform overwhelming complexity into manageable, meaningful representations by intelligently clustering network elements.
Strategies for grouping in network topology
Grouping is a visualization technique aggregating individual network elements into logical clusters based on various criteria. These criteria can include:
- Physical location (e.g., data centers, office branches)
- Functional role (e.g., web servers, databases, load balancers)
- Network segment (e.g., VLANs, subnets)
- Organizational structure (e.g., departments, project teams)
- Performance characteristics (e.g., high-traffic nodes)
Grouping allows for multiple levels of abstraction, enabling viewers to zoom in and out of the network topology as needed. You might see only major network segments or geographical locations at the highest level. As you drill down, individual devices and connections within each group become visible.

Benefits of grouping in network visualization
- Simplified overview: Grouping provides a clear, high-level view of the network structure, making it easier to understand the overall architecture at a glance.
- Scalability: As networks grow, grouping ensures that visualizations remain manageable and meaningful, regardless of the number of individual elements.
- Efficient troubleshooting: Grouping helps identify resource allocation patterns and optimize distribution across the network. When issues arise, administrators can quickly narrow down the problem area by navigating through relevant groups rather than sifting through thousands of individual devices.
- Enhanced security analysis: When network elements are logically grouped, security teams can more easily assess and manage security policies.
- Improved communication: Grouped visualizations are an effective communication tool, allowing technical and non-technical stakeholders to discuss network architecture more easily.
Deciphering complexity using hierarchical visualization
In the ever-expanding universe of enterprise networks, making sense of intricate topologies has become a formidable challenge. Network administrators can use the hierarchical visualization technique to bring order to chaos and clarity to complexity. Let's explore how this approach revolutionizes how we view and manage network infrastructures.
Strategies for hierarchical visualization
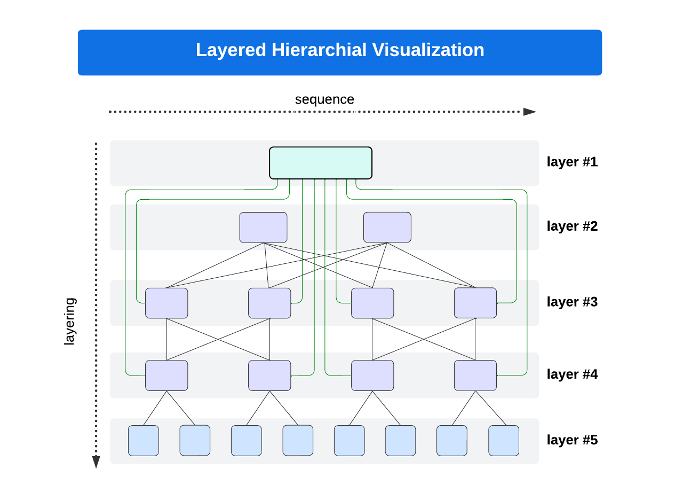
Hierarchical visualization is a method of representing network topology in a layered, tree-like structure. It organizes network elements into different levels of abstraction, allowing viewers to navigate from high-level overviews down to granular details with ease. Key features of hierarchical visualization include:
- Multi-level views: Network elements are arranged in a hierarchy, typically starting with the broadest view at the top and becoming more detailed at lower levels.
- Drill-down capability: Users can click on higher-level elements to reveal more detailed information about underlying components.
- Collapsible/expandable nodes: Elements can be collapsed to simplify the view or expanded to show more detail, allowing for dynamic network exploration.
- Context preservation: Even when focusing on detailed views, the overall context of where these elements fit in the larger network is maintained.
- Relationship preservation: Even at higher levels of abstraction, critical relationships between network segments are maintained, ensuring important connections are not lost.

Benefits of hierarchical network visualization
- Managing complexity: By organizing network elements into logical hierarchies, administrators can more easily grasp the overall structure of complex networks.
- Efficient navigation: Quickly move between high-level overviews and detailed inspections of specific network segments or devices.
- Scalability: Hierarchical views can accommodate networks of any size, making them particularly valuable for large, distributed infrastructures.
- Improved troubleshooting: Rapidly isolate issues by drilling down into problematic areas while maintaining awareness of their place in the broader network context.
- Enhanced resource planning: Easy identification of resource distribution and utilization patterns across different levels of the network hierarchy provides stakeholders with intuitive, multi-layered views of the network that can be understood at various levels of technical expertise.
Navigating complexity using customizable filtering and tagging
In today's exponentially growing network landscapes, finding the correct information at the right time can feel like searching for a needle in a digital haystack. Customizable filtering and tagging can be powerful tools that transform how we interact with and understand complex network topologies. Let's explore how these features are revolutionizing network visualization and management.
Strategies for filtering and tagging
Filtering can be thought of as your network's search engine. It allows you to sail through the vast sea of network data, displaying only the elements that match your specific criteria. At the same time, tagging can be considered your network's organizational system. It enables you to attach custom labels to network elements, creating a flexible, user-defined categorization scheme.
Strategies for effective filtering and tagging implementation include:
- Consistent tagging taxonomy: Create a standardized system for tagging to ensure consistency across the organization.
- Compound filters: Combine multiple filters to create highly specific views for complex analyses.
- Role-based filter sets: Develop preset filter combinations tailored to different roles within the IT team.
- Dynamic filtering: This allows filters to update in real time based on changing network conditions or metrics.
- Collaborative tagging: Allow team members to share and collaborate on tag creation and management.
Benefits of network topology filtering and tagging
- Adaptive views: Instantly adjust your network perspective based on current needs. Whether you're focusing on security, performance, or capacity planning, a few clicks can reshape your entire view.
- Rapid problem isolation: When issues arise, quickly filter out the noise and zoom in on potential problem areas, significantly reducing mean time to resolution.
- Custom lenses for different roles: Network architects, security teams, and operations staff can each have tailored views, seeing the network through the lens most relevant to their responsibilities.
- Dynamic grouping: Use tags to create ad-hoc groups of network elements, enabling fluid, context-specific organization that traditional static grouping can't match.
- Trend and pattern discovery: By filtering and comparing different tagged groups, uncover hidden patterns or anomalies in your network's behavior or structure.
Conclusion
As networks continue to grow in scale and complexity, leveraging grouping, hierarchical visualization, filtering, and tagging techniques can significantly enhance network topology visualization. By implementing intelligent grouping strategies, organizations can enhance their network visibility, improve operational efficiency, and ultimately make more informed decisions about their network infrastructure. By providing a structured, navigable view of complex network topologies, it empowers administrators to manage, troubleshoot, and optimize their networks with unprecedented efficiency. By providing the ability to create precise, tailored views of the network, these features empower administrators to navigate the complexity of modern networks with unparalleled agility and insight.
Only through such comprehensive and dynamic visualization techniques can network teams hope to regain the visibility necessary to effectively manage, secure, and optimize the intricate digital ecosystems that now form the backbone of modern enterprises.

Manvendra Singh
Manvendra Singh is a Software Architect for NetOps at Broadcom. He has over 18 years of experience designing and developing enterprise-grade products for monitoring and observability. His expertise spans legacy systems to cutting-edge technologies, and he specializes in building solutions that bridge traditional and...
Other resources you might be interested in
Clarity 101 - From Strategy to Reality
Learn how Clarity helps you achieve Strategic Portfolio Management.
Working with Custom Views in Rally
This course introduces you to working with custom views in Rally.
Rally Office Hours: February 12th, 2026
Catch the announcement of the new Rally feature that enables workspace admins to set artifact field ordering. Learn about ongoing research and upcoming events.
The Architecture Shift Powering Network Observability
Discover how NODE (Network Observability Deployment Engine) from Broadcom delivers easier deployment, streamlined upgrades, and enhanced stability.
Rally Office Hours: February 5, 2026
Learn about new endorsed widgets and UX research needs, and hear from the Rally team about key topics like user admin, widget conversion, custom grouping, Slack integration, and Flow State filtering.
AppNeta: Design Browser Workflows for Web App Monitoring
Learn how to design, build, and troubleshoot Selenium-based browser workflows in AppNeta to reliably monitor web applications and validate user experience.
DX NetOps: Time Zone and Business Hours Configuration and Usage
Learn how to set and manage time zones and business hours within DX NetOps Portal to ensure accurate data display and optimize analysis and reporting.
Rally Office Hours: January 29, 2026
Learn more about the deep copy feature, and then hear a follow-up discussion on the slipped artifacts widget and more in this week's session of Rally Office Hours.
When DIY Becomes a Network Liability
While seemingly expedient, custom scripts can cost teams dearly. See why it’s so critical to leverage a dedicated network configuration management platform.