|
Key Takeaways
|
|
In today's sprawling enterprise environments, keeping the network running smoothly isn’t just a technical hurdle—it’s a logistical marathon.
Enterprise IT environments are in constant motion. New employees come on board. Contractors rotate in and out. Departments roll out new tools. Corporate offices expand, consolidate, or close. And users demand flawless connectivity from wherever they are.
Imagine you’re responsible for network operations in an organization that has 8,000 employees. During any given week, dozens of people may join or leave. Meanwhile, those people are scattered across offices in multiple countries, connecting from hotel rooms, home networks, coffee shops, branch locations, and airports. All the while, you’re contending with a blend of legacy systems, cloud applications, and ever-evolving security protocols and threats.
Meanwhile, many network operations teams struggle to retain staff and budgets remain tight, and these demands only tend to get more onerous. How do you stay on top of the chaos so you can ensure you’re delivering flawless digital experiences?
Introducing a better way: Configure once, scale infinitely
Network Observability by Broadcom delivers a range of capabilities that enable teams to keep pace with these ever-evolving, ever-expanding demands. The solution’s design and development are guided by a key mantra: “configure once, scale infinitely.”
Featuring support for advanced monitoring policies, AppNeta by Broadcom offers key capabilities that embody the realization of this principle. These capabilities fundamentally shift how teams configure, manage, and scale their observability practices. With AppNeta, you can set up intelligent rules and apply them across logical groups—meaning you can stop wasting time replicating the same configuration dozens (or hundreds) of times.
Here’s the beauty of it: when you set a monitoring policy for a specific group—say, a development team that accesses a specific set of coding environments and tools—anyone who joins that group automatically gets the right monitoring applied. No extra clicks. No oversight risk. Just effective, consistent observability.
The power of monitoring policies, rules, and groups
AppNeta features support for three key components that work together to deliver a smarter, more scalable monitoring setup: policies, rules, and groups. Here’s more on how each are employed:
1. Policies: Your configuration powerhouse
Policies offer a powerful way to simplify and automate monitoring. Administrators can configure policies once and do onboarding automatically as new users come online. Monitoring policies can be automatically applied to people who log in from certain locations or connect to specific apps. For example, a policy can be established for new members of an IT team who need to access the company’s ITSM platforms. In this way, policies help ensure more consistent monitoring for better correlation.
2. Rules: Intelligence behind the automation
Rules are an extension of policies. They make it easy to define what gets monitored and how—whether it’s a particular application, endpoint, or network path. As changes occur, rules can help ensure that the required updates are made. Rules make it easier to handle diverse network setups—even if you’re dealing with a mix of VLANs, SD-WANs, wired Ethernet, and Wi-Fi. Rules adapt dynamically, which means less manual oversight and more confidence in your coverage.
3. Groups: Organize with purpose
Groups let you apply policies and rules consistently across sets of users, technologies, or locations. For example, you can establish groups around organizational departments, such as development, IT, finance, or any other set of users that target specific apps or endpoints. Groups can also be established for specific office locations or regions.
Unlocking a world of advantages
Let's dive into the key advantages that make AppNeta a game-changer for enterprises:
1. Consistent, efficient setup: Say goodbye to repetition
Tired of configuring the same settings over and over again? AppNeta lets you apply settings across logical groups rather than on a cumbersome policy-by-policy basis. You can set up your monitoring configuration once, and it will be automatically applied to new users or network paths based on your established criteria. This means less manual effort and more time for strategic initiatives.
2. Easy, complete setup: All the tests you need, right out of the box
AppNeta has always been celebrated for not requiring teams to individually configure tests. Monitoring policies take that ease to the next level. By default, a new monitoring policy can have all the tests you need, from crucial metrics like latency and data loss to more advanced measurements like jitter and mean opinion score. You get comprehensive monitoring without the headache of intricate setup.
3. Easier updates: Propagate changes with a click
Things change and your network monitoring needs to adapt. With this solution, applying changes and automatically propagating settings across relevant policies is a breeze. No more manual updates across countless individual configurations—the system does the heavy lifting for you.
4. Easy adaptation: Seamlessly embrace new apps and changes
What happens when your business leaders decide to adopt new applications? With AppNeta, you can seamlessly add those apps. If a new app belongs to or is used by an existing group, simply add it to that group, and all your established rules remain intact, without any need for reconfiguration. This flexibility ensures your monitoring evolves as your business does.
5. Flexible management: Control and granularity at your fingertips
The solution provides incredible flexibility in managing your monitoring policies. You can easily move policies in or out of groups as your needs evolve, and the system clearly specifies which policies will be affected when you apply and propagate settings.
Plus, here's a standout feature: policy overrides. This allows you to maintain flexibility for specific, unique monitoring needs. For example, if one application has different latency or performance tolerances than others, policy overrides make it incredibly easy to adapt to these distinctions, without disrupting your overall monitoring strategy.
6. Comprehensive, accurate insights: Beyond basic monitoring
Move beyond superficial monitoring with accurate, deep insights into network behavior and application performance. The solution allows you to target specific applications or endpoints, whether they reside in a data center or a cloud environment. You can track pathways between different locations. From any employee location, you can monitor connectivity to any specific endpoint—be it an instance of an app hosted in the closest data center or within a cloud provider’s environment.
Crucially, this comprehensive insight helps teams avoid false positives and red flags. Imagine an operator seeing different latency issues from various locations that aren't tied to an app but rather to the network in that specific location. The solution enables teams to distinguish between an issue arising when an employee is traveling or working from home versus in the office. Being able to distinguish between these scenarios makes your monitoring policies incredibly powerful and your troubleshooting far more precise.
Real results: From manual chaos to streamlined intelligence
With this policy-driven model, your organization can realize a range of meaningful benefits:
- Less manual effort. No more copying and pasting the same policy across dozens of endpoints. Set it up once, and it applies automatically.
- Faster troubleshooting. With consistent policies and comprehensive rules, your monitoring data is uniform—making it faster and easier to spot anomalies, identify root causes, and fix issues.
- Easier adaptation. When your business adopts a new tool or shifts employees between departments, monitoring changes can be made quickly and confidently.
- Stronger scalability. Whether your network grows by 50 users or 5,000, AppNeta policies scale with you. No overwhelming overhead. No monitoring gaps.
- Better insights, fewer false alarms. AppNeta can distinguish between latency caused by app performance and latency caused by an employee working from a slow home network. That nuance helps avoid red flags that waste time and trigger unnecessary escalations.
How it works: A quick tour
Getting started with monitoring policies in AppNeta is simple. From the main interface, take these steps:
- Click the gear icon in the top right corner.
- Select Monitoring Policies.
- Browse all policies and groups from a central dashboard, complete with meta information.
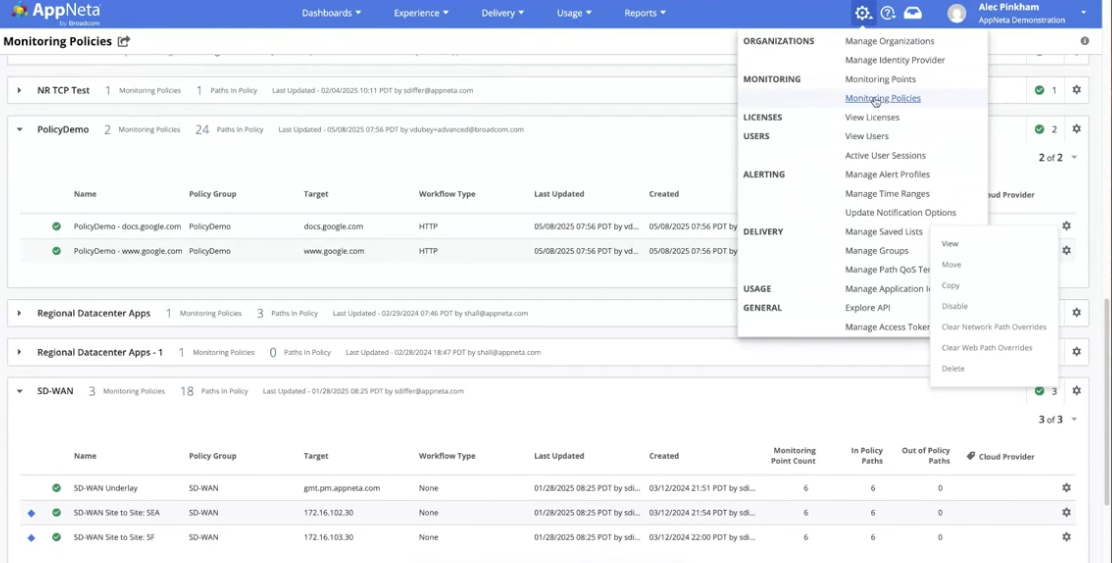
You can easily filter this view based on a range of criteria.
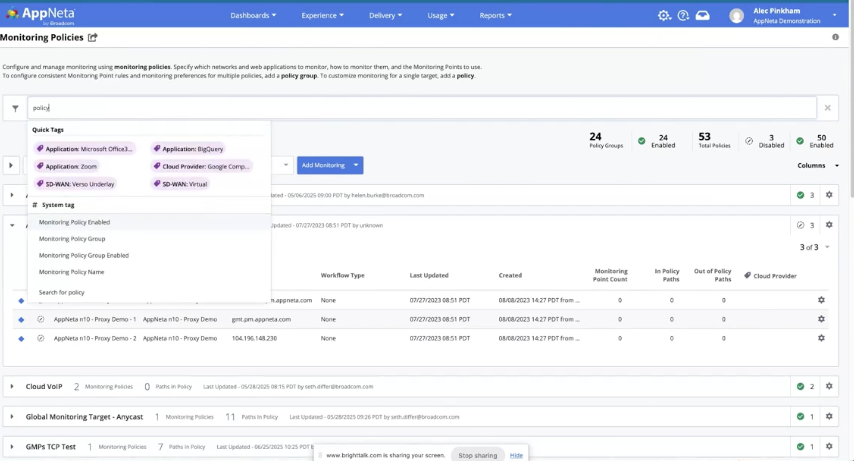
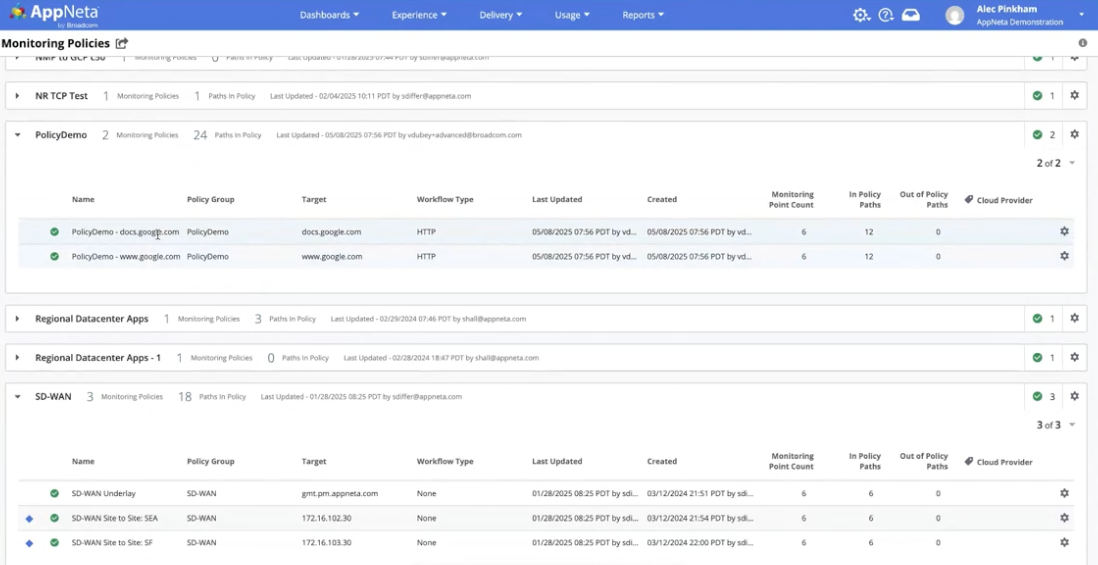
(In our example, we have a policy targeting google.com and docs.google.com.)
With the solution, you have a wide range of options:
- View and edit preferences, such as web monitoring and network monitoring preferences.
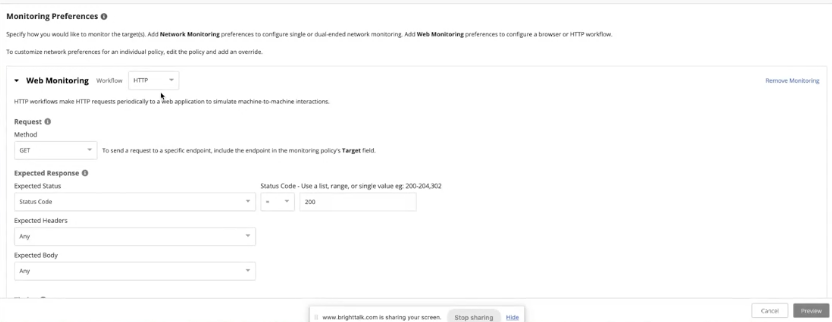
- Choose from web and network monitoring types. (AppNeta allows you to have both types in the same group.)
- Set up HTTP tests to gain status updates, such as submitting a get request.
- Bring in web policies to establish web synthetic transaction monitoring.
- Pull in BGP information or incorporate network server browser faults.
- Change the protocol being monitored, including specifying network type or voice codec for tracking mean opinion score, voice loss, or voice jitter metrics.
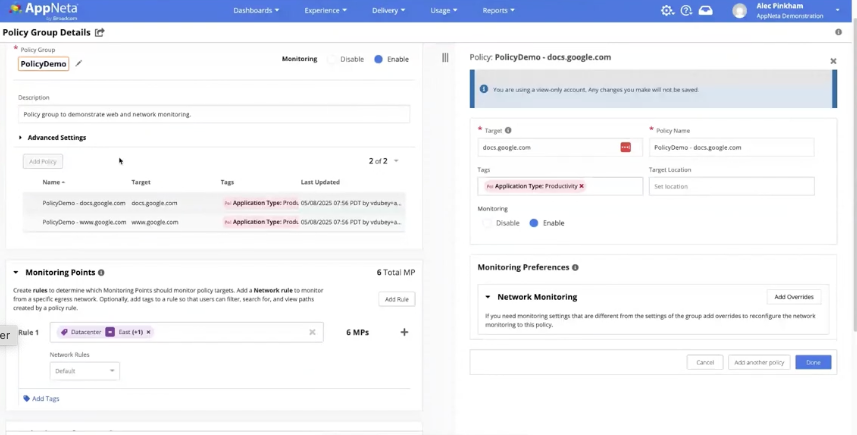
This can all be done with the comprehensive tagging we have within AppNeta.
The bottom line: Smarter observability for the modern enterprise
Modern enterprises don’t stand still—and neither do the networks they rely upon. With AppNeta you can establish policy-driven observability, so you can get out of fire-fighting mode and stay in front of all the change.
With AppNeta’s monitoring policies, rules, and groups, you can leverage a powerful framework for scalable, flexible, and accurate network observability. You gain more control with less effort, deeper insight with fewer blind spots, and a monitoring setup that evolves as fast as your business.
To learn more, be sure to view our Small Bytes webcast, Automating Network Observability with AppNeta Monitoring Policies. Also, check out our AppNeta Admin: Installation and Configuration learning path, which features training on installation, configuration, and management.

Alec Pinkham
Alec is a Product Marketing Manager for the AppNeta solution at Broadcom. He spent seven years with AppNeta in the Application and Network Performance Monitoring space before joining Broadcom. Prior to AppNeta his background is in software product management in HMI/SCADA solutions for industrial automation as well as...
Other resources you might be interested in
Controlling Flow Telemetry Overhead in Distributed Environments
See how the latest updates to NetOps Flow reduce telemetry overhead and optimize WAN usage. Simplify data extraction and integration with the OData 4 API.
Clarity: Managing Reports
This course is designed for report consumers who need to access, analyze, and manage published reports in Clarity.
Automic Integration Brochure
This brochure serves as your guide to the diverse tools, platforms, and systems that can connect seamlessly with Automic.
Clarity: Configure Reporting Data Sources Using Data Providers
This course explains the data foundation that supports Reporting in Clarity. Learn how Data Providers prepare, organize, secure, and validate reporting data.
Rally Office Hours: July 9, 2026
This session covers the general availability of milestone delivery confidence, troubleshooting for custom views and admin functions, and upcoming webinars.
Network Observability NCM
See how Network Observability NCM delivers network configuration management capabilities that automate remediation, ensure compliance, and mitigate risk.
Rally Office Hours: July 2, 2026
Explore the July 2, 2026, Rally Office Hours session covering OAuth security updates, the new portfolio item flow states beta, and upcoming event news.
Unleashing Enterprise Agility: The Power of Portfolio Kanban Flow States
Learn how Rally's Customizable Portfolio Item Flow States (PIFS) balance team autonomy with executive visibility to accelerate enterprise value delivery.
Chart Your Team’s Analytics Journey with Customizable Dashboards in DX NetOps
DX NetOps now features customizable dashboards, providing standards-based flexibility and an easy way for new and existing users to add custom dashboards.