|
Key Takeaways
|
|
With application synthetic monitoring capabilities, DX Operational Observability (DX O2) can monitor websites and other services by probing the target from various globally distributed monitoring stations. These capabilities, which support SaaS and on-premises deployments, help teams shift from reactive to proactive management, elevate user experience for monitoring, and raise observability to a new level.
Previously, with DX Application Performance Manager and DX Operational Intelligence, integrating ASM metrics was achieved through an extension of the Application Performance Management Infrastructure Agent (APMIA).
Now, with DX O2, the integration can be done natively through the product’s user interface. The Preferences menu appears in the top-right menu, under the logged in user name.
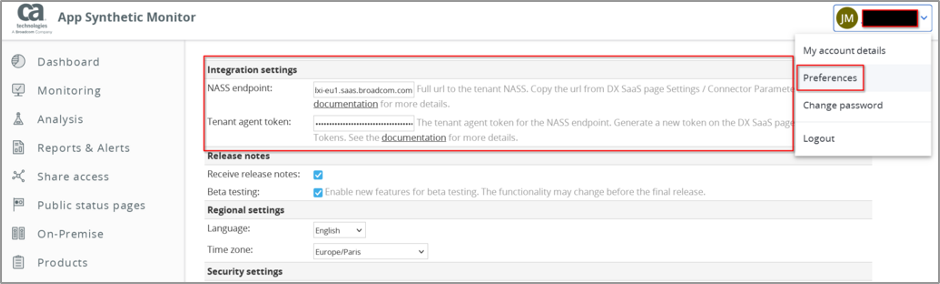
Only two variables are needed: Ingestion URL and Agent Token. To get these variables, log into the DX O2 that you want to enable for synthetics.
1. The NASS endpoint URL (Ingestion URL). You will find this value in DX O2 under "Settings" => Access Tokens/Security => Connector Parameters".
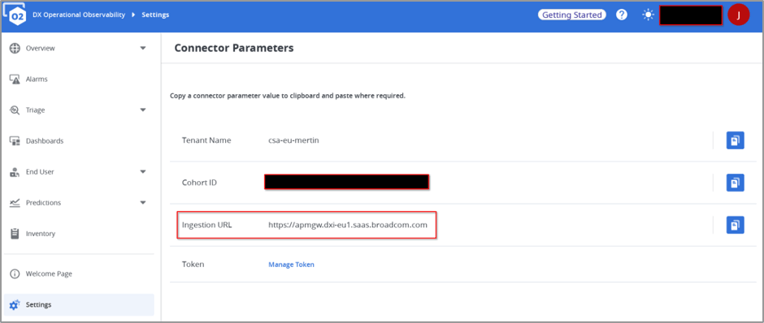
In the Connection Parameters section, the NASS URL is identified as the Ingestion URL.
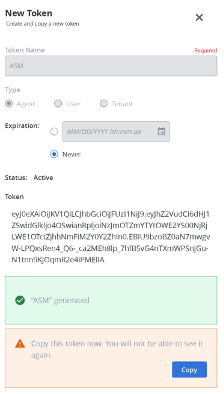
2. The Agent Token (authentication and identification). To create the Agent Token required by DX O2, go to "Settings" => Access Tokens/Security => Agent Tokens". Paste this into the "Tenant Agent Token" field in the DX ASM preferences configuration.
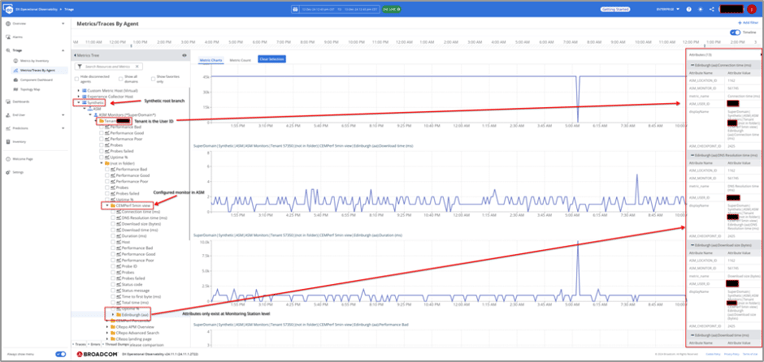
After you enter and save the configured setting, you will see the "Synthetic" root entry displayed in the Metric Tree. This may take a few minutes.
Operators will now be able to configure alerts and trigger levels as they do for regular applications in DX O2.
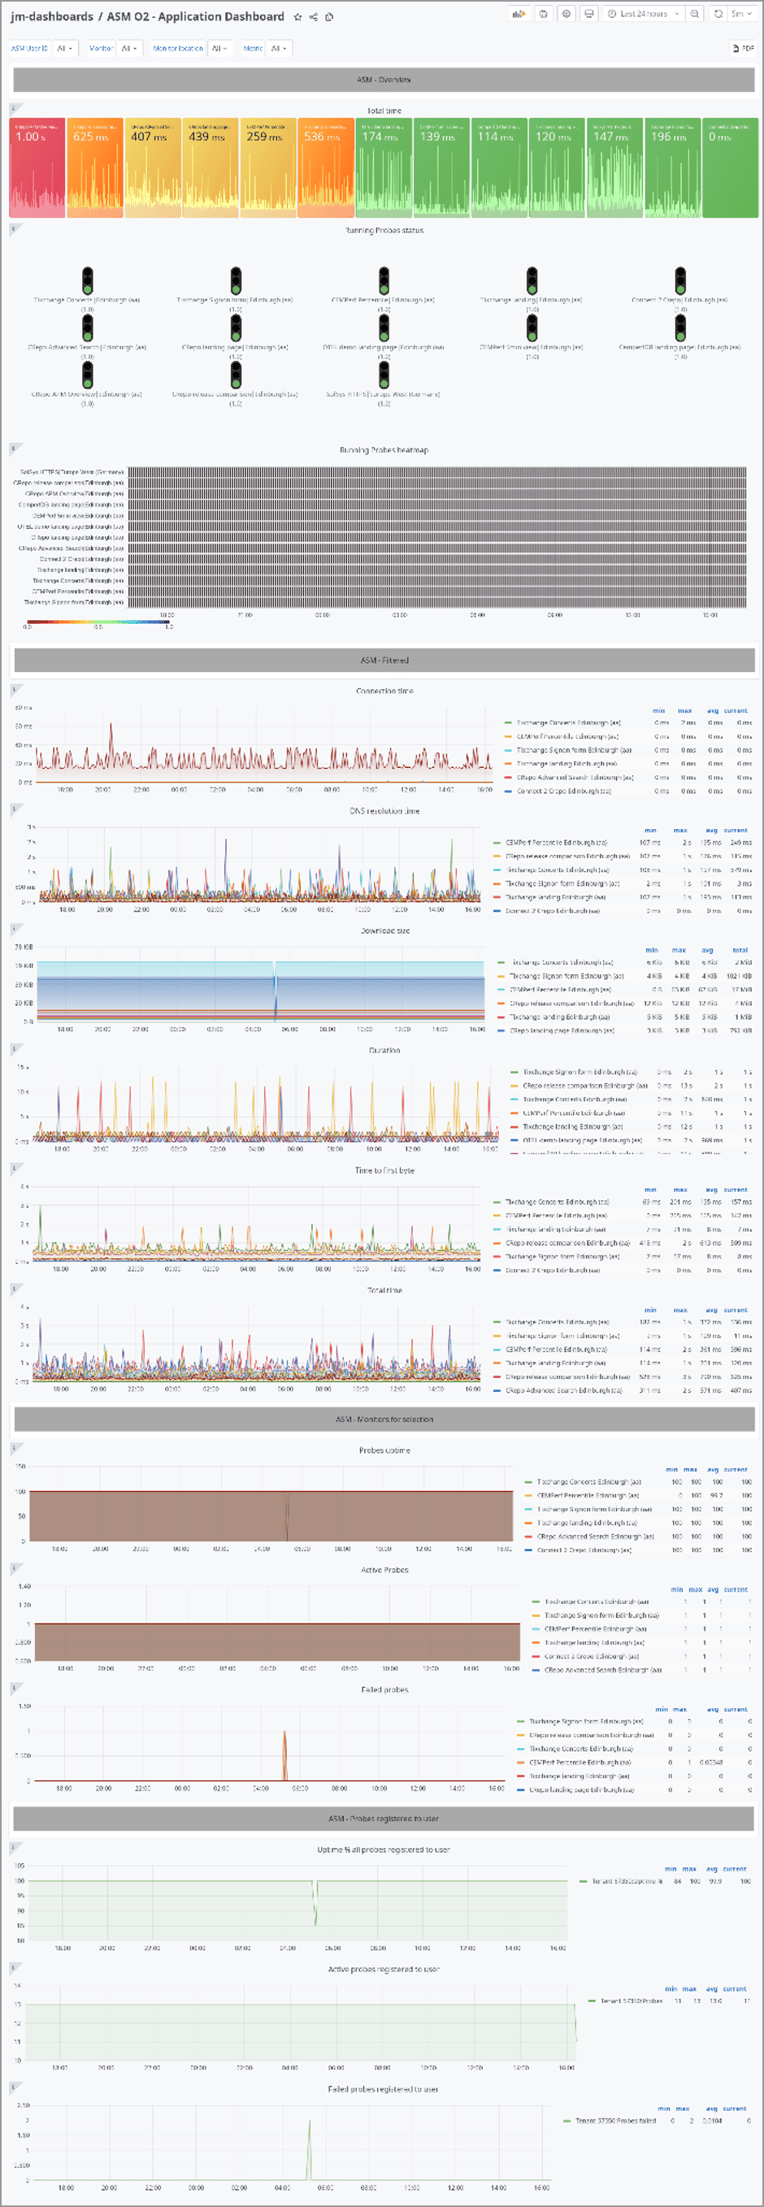
Operators can also create dashboards to show the current operations of the Synthetic Monitor. Dashboards for synthetics can display metrics such as Connection Time (ms), DNS Resolution Time (ms), Download Size (bytes), Download Time (ms), Duration (ms), Performance Bad, Performance Good, Probes, and more.
To help operators get started, DX O2 includes pre-built dashboards that include these metrics. See a sample dashboard and its description below.
In conclusion, integrating synthetics with DX O2 provides the ability to monitor both the user experience and the application’s health in a more comprehensive and effective manner. This combination enables proactive identification of issues so they may be resolved before they affect production. Ultimately, this leads to enhanced application reliability and better user experiences.
The sample dashboard below includes all reported synthetic metrics. The dashboard includes:
- Current reported request times compared to configured targets.
- Current availability of configured monitors, displayed as heat maps.
- Information on reported monitoring metrics, displayed as graphs.
- Monitoring filter(s) applied, displayed in the top row.
Note: For SaaS customers, contact support for assistance to enable native synthetics integration for your tenant.
For additional details, visit the Frequently Asked Questions page here.

Jörg Mertin
Jörg Mertin, a Master Solution Engineer on the AIOps and Observability team, is a self-learner and technology enthusiast. A testament to this is his early adopter work to learn and evangelize Linux in the early 1990s. Whether addressing coordinating monitoring approaches for full-fledged cloud deployments or a...
Other resources you might be interested in
This Halloween, the Scariest Monsters Are in Your Network
See how network observability can help you identify and tame the zombies, vampires, and werewolves lurking in your network infrastructure.
Your Root Cause Analysis is Flawed by Design
Discover the critical flaw in your troubleshooting approaches. Employ network observability to extend your visibility across the entire service delivery path.
Whose Fault Is It When the Cloud Fails? Does It Matter?
In today's interconnected environments, it is vital to gain visibility into networks you don't own, including internet and cloud provider infrastructures.
The Future of Network Configuration Management is Unified, Not Uncertain
Read this post and discover how Broadcom is breathing new life into the trusted Voyence NCM, making it a core part of its unified observability platform.
Rally Office Hours: October 9, 2025
Discover Rally's new AI-powered Team Health Widget for flow metrics and drill-downs on feature charts. Plus, get updates on WIP limits and future enhancements.
AAI - Navigating the Interface and Refining Data Views
This course introduces you to AAI’s interface and shows you how to navigate efficiently, work with tables, and refine large datasets using search and filter tools.
Rally Office Hours: October 16, 2025
Rally's new AI-driven feature automates artifact breakdown - transforming features into stories or stories into tasks - saving time and ensuring consistency.
What’s New in Network Observability for Fall 2025
Discover how the Fall 2025 release of Network Observability by Broadcom introduces powerful new capabilities, elevating your insights and automation.
Modernizing Monitoring in a Converged IT-OT Landscape
The energy sector is shifting, driven by rapid grid modernization and the convergence of IT and OT networks. Traditional monitoring tools fall short.