|
Key Takeaways
|
|
SD-WAN has revolutionized how organizations optimize network performance and enhance connectivity across geographically dispersed locations. However, to fully capitalize on the benefits of SD-WAN, it is crucial organizations implement robust operational and monitoring practices. This is especially important given the growing operational and security challenges associated with the rising popularity of cloud-based services and SaaS applications.
A recent survey from EMA Research on WAN transformation reveals that 63% of companies now use the internet as their primary WAN connectivity. This indicates that many organizations are not just adopting SD-WAN but are also transitioning from MPLS networks to broadband internet. This shift from private, SLA-driven connections to public networks inherently increases the complexity of network management due to the reduced visibility and the involvement of multiple third-party providers.
Given these challenges, what key considerations should you consider to ensure the success of your VMware VeloCloud SD-WAN deployments?
Validate overlay quality
Traditionally, monitoring has focused on internally owned and managed networks, often providing only basic up-or-down status without much contextual intelligence. However, with SD-WAN, where you don’t own the entire network infrastructure, it’s essential to adopt solutions that enable end-to-end performance monitoring. This is especially important given the variability of the internet as a communication layer. With SD-WAN, you must correlate the underlay network performance to the overlay network.
Diagnose underlay issues
With the expanded scope of responsibility, you are now accountable even when communication issues occur outside the networks you directly control. Getting an ISP to acknowledge performance issues can be challenging. Therefore, you need tools that can thoroughly analyze user traffic routes. When problems arise, it’s crucial to identify the problem’s domain, the location, and who’s responsible for fixing the situation—whether it’s within your internal network or outside it. Providing evidence to escalate issues with ISPs is vital for effectively managing Mean Time to Repair (MTTR).
Verify cloud connections
Recognizing when a service is down or underperforming is valuable only if you can assess whether your organization is impacted. Therefore, monitoring cloud service performance from the end-user’s perspective is essential. Make no mistake—the new key performance indicator is user experience. This is the only metric that determines the level of service you deliver to the end users; it is also the only metric that can keep you out of trouble. As you invest significant resources in modern network technologies, scrutiny on the network intensifies. Whether you adopt an offensive or defensive approach, it’s imperative to provide clear, data-driven insights to present an unbiased view of the service quality you deliver to internal and external customers.
AppNeta for VeloCloud
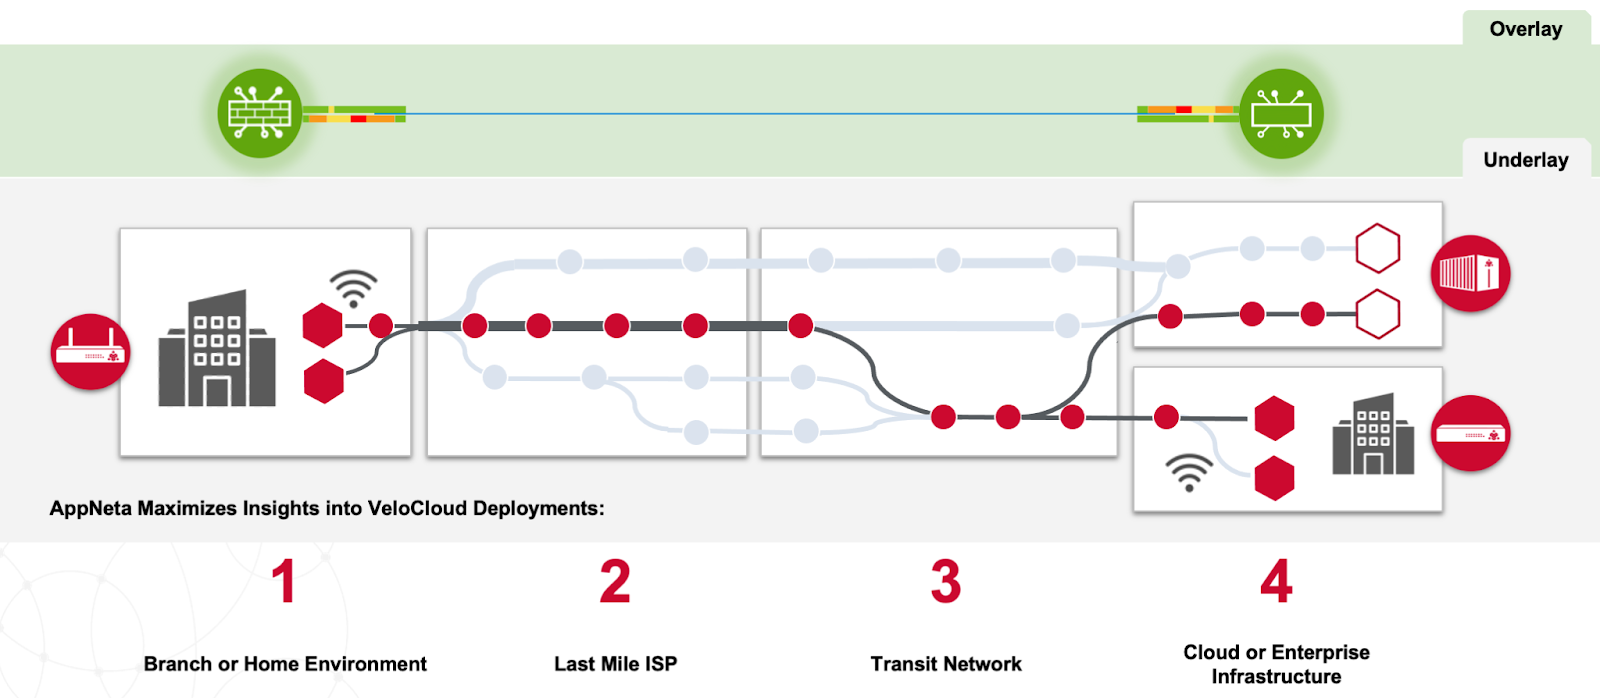
As SD-WAN controllers typically offer visibility into the overlay, they provide limited insight into the underlay, especially when it involves circuits managed by third-party providers. This limitation makes it challenging to determine whether an issue lies with the corporate network, an ISP, or a cloud provider.
AppNeta by Broadcom complements VeloCloud by filling this visibility gap, offering the end-to-end insights necessary for effectively managing your networks, even beyond the edge. The solution utilizes continuous path analysis to detect network problems and automatically initiates diagnostic tests to help identify the root cause. AppNeta allows for the monitoring of site-to-site and site-to-cloud connections, extending these capabilities to track region-to-region transmissions within a single cloud provider, cloud-to-cloud connections in multi-cloud environments, and cloud-to-SaaS connections.
Leveraging these advanced monitoring capabilities, AppNeta enhances VeloCloud visibility, empowering you to answer complex questions such as:
- Are specific routes experiencing slowdowns?
- Which routes are down, and when did the outage occur?
- Where within the autonomous systems is the issue arising?
- What level of capacity is my ISP actually providing?
Now, let’s explore how AppNeta enhances VeloCloud monitoring in three ways, enabling end-to-end visibility across your network.
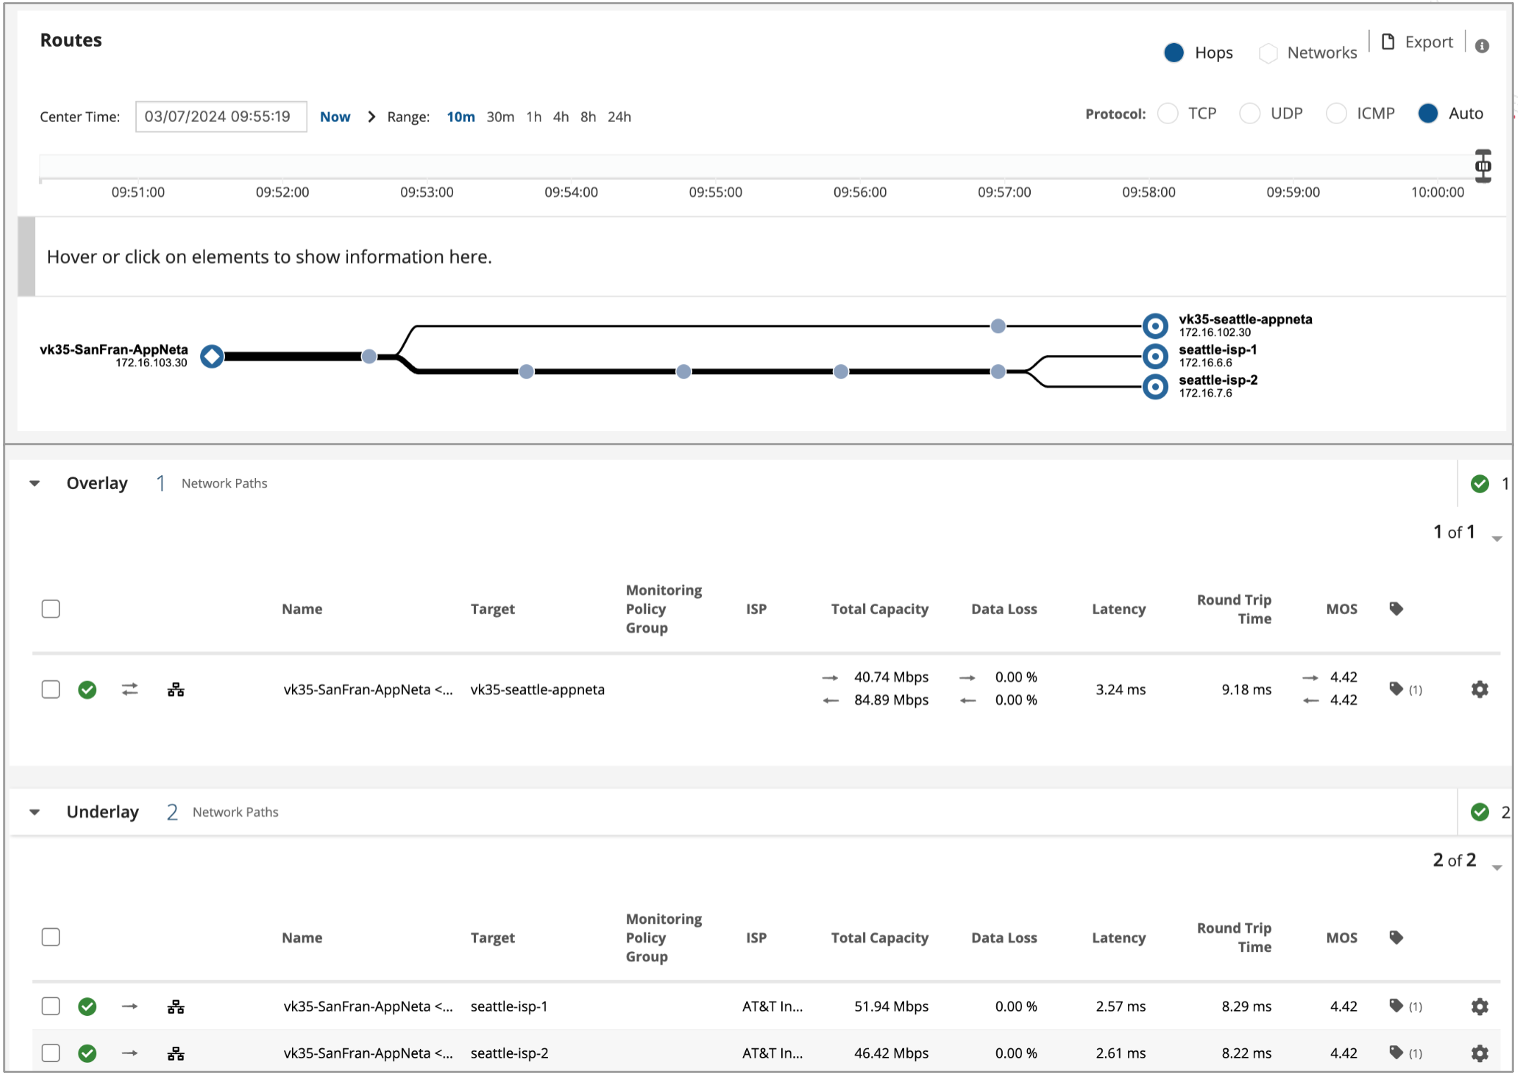
1. TruPath technology for overlay and underlay correlation
AppNeta’s TruPath technology is designed to monitor extensive network paths with minimal overhead. TruPath measures a wide range of network metrics over extended periods, such as bandwidth, loss, jitter, latency, and MOS. It enables the assessment of overall path quality by correlating the overlay performance to the underlay, ensuring that both layers are performing optimally.
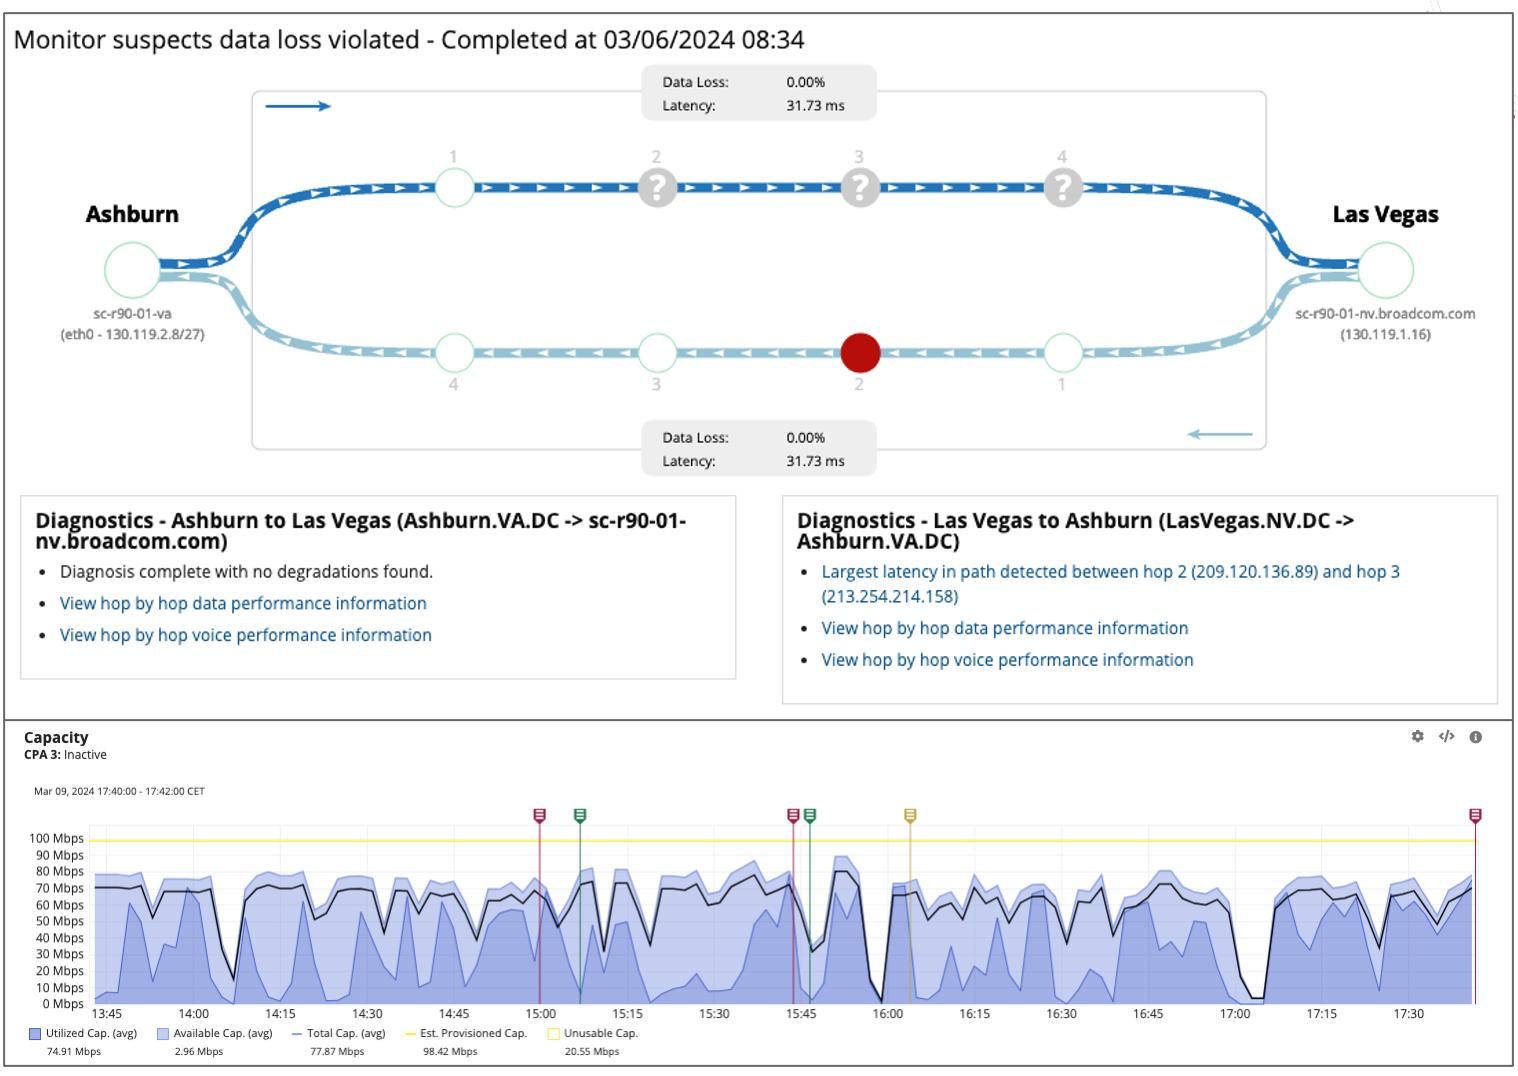
2. Hop-by-hop diagnostics for issue localization
TruPath continuously monitors all network devices or "hops" that data passes through. These measurements allow AppNeta to detect performance issues and pinpoint the exact location of problems within ISP and CSP networks through hop-by-hop diagnostics. Leveraging TruPath, you can track how routes change over time, review connectivity failures, track capacity variations, and determine which ISP should be held accountable for issues.
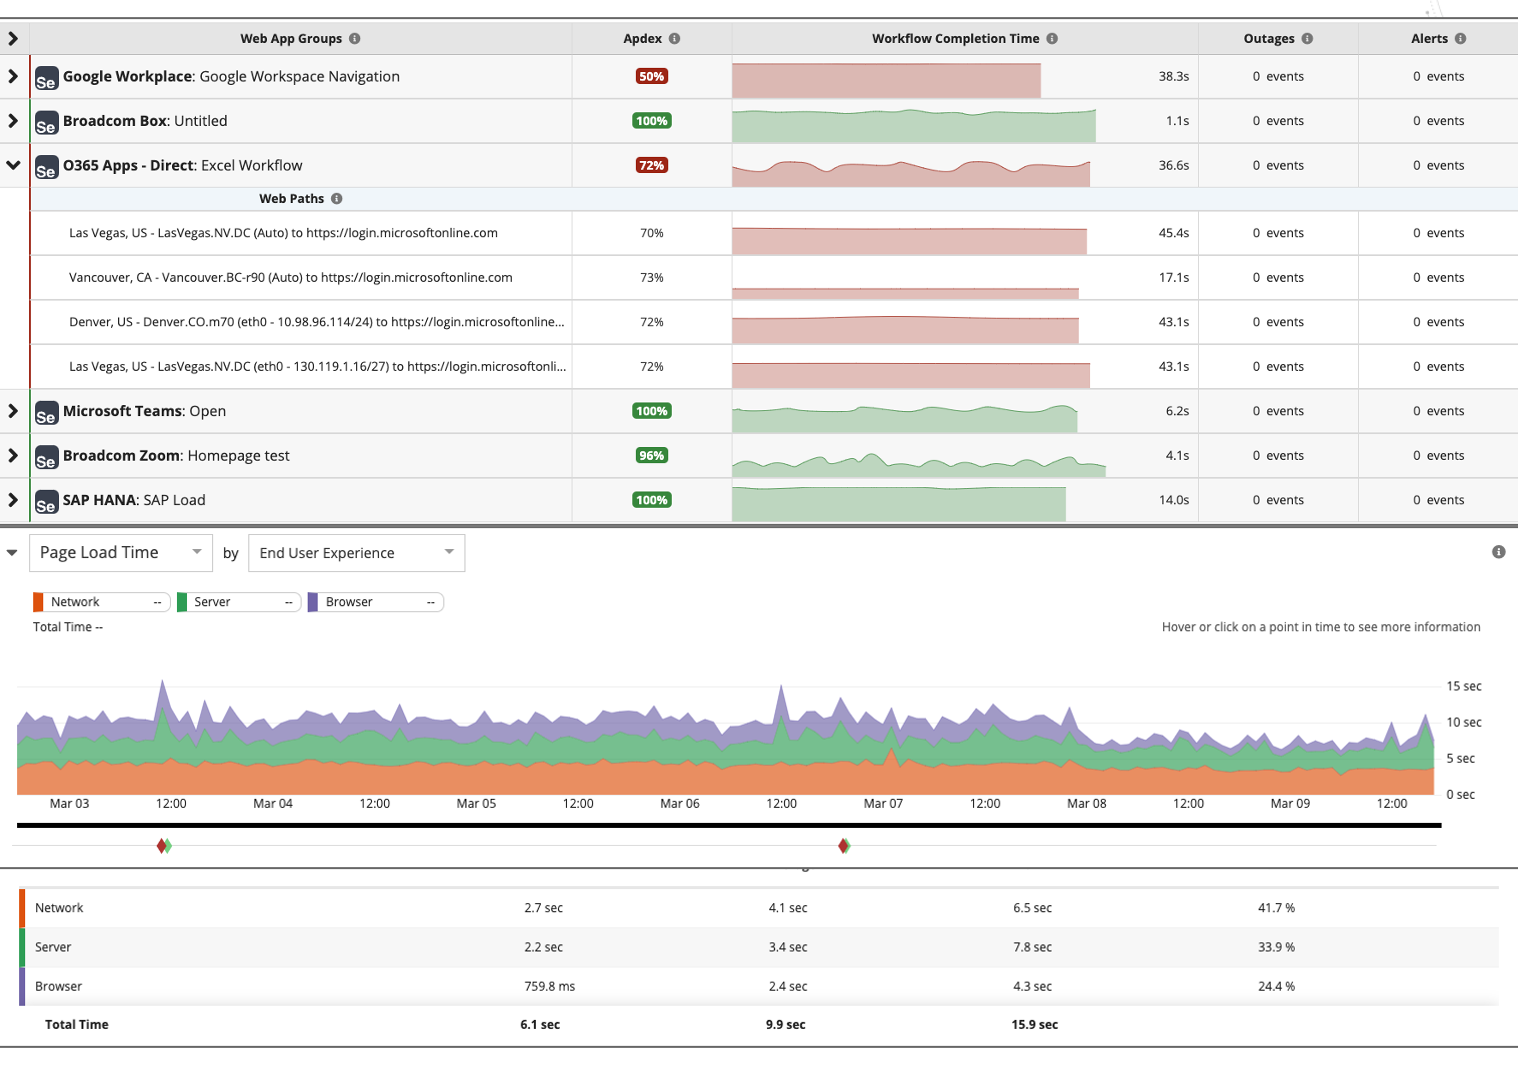
3. Synthetic monitoring for SaaS and cloud services
AppNeta also incorporates synthetic monitoring, a modern approach for observing trends in the performance of web and SaaS applications. This method uses Selenium scripts to simulate the paths and actions end-users take within an application. Automated tests are run periodically to detect any degradation in response times. To assess application status, AppNeta uses Apdex, a standardized metric that evaluates application responsiveness based on user satisfaction.
Drawing it all together
AppNeta complements VeloCloud by delivering the end-to-end insights needed to navigate the complexities of modern, multi-cloud environments. AppNeta enables network operations to fully understand how performance is affected by common issues like application outages, route changes, connectivity drops, and ISP peering changes. By using AppNeta along with VeloCloud, organizations can achieve a deeper understanding of their network’s performance, leading to improved service quality, quicker issue resolution, and ultimately, greater satisfaction for the end users.
Discover more about AppNeta by exploring our dedicated Network Observability microsite. Dive into in-depth resources and expert insights to enhance your network performance and visibility.

Yann Guernion
Yann has several decades of experience in the software industry, from development to operations to marketing of enterprise solutions. He helps Broadcom deliver market-leading solutions with a focus on Network Management.
Other resources you might be interested in
Controlling Flow Telemetry Overhead in Distributed Environments
See how the latest updates to NetOps Flow reduce telemetry overhead and optimize WAN usage. Simplify data extraction and integration with the OData 4 API.
Clarity: Managing Reports
This course is designed for report consumers who need to access, analyze, and manage published reports in Clarity.
Automic Integration Brochure
This brochure serves as your guide to the diverse tools, platforms, and systems that can connect seamlessly with Automic.
Clarity: Configure Reporting Data Sources Using Data Providers
This course explains the data foundation that supports Reporting in Clarity. Learn how Data Providers prepare, organize, secure, and validate reporting data.
Rally Office Hours: July 9, 2026
This session covers the general availability of milestone delivery confidence, troubleshooting for custom views and admin functions, and upcoming webinars.
Network Observability NCM
See how Network Observability NCM delivers network configuration management capabilities that automate remediation, ensure compliance, and mitigate risk.
Rally Office Hours: July 2, 2026
Explore the July 2, 2026, Rally Office Hours session covering OAuth security updates, the new portfolio item flow states beta, and upcoming event news.
Unleashing Enterprise Agility: The Power of Portfolio Kanban Flow States
Learn how Rally's Customizable Portfolio Item Flow States (PIFS) balance team autonomy with executive visibility to accelerate enterprise value delivery.
Chart Your Team’s Analytics Journey with Customizable Dashboards in DX NetOps
DX NetOps now features customizable dashboards, providing standards-based flexibility and an easy way for new and existing users to add custom dashboards.