| Note: This post was co-authored by Adam Frary |
|
Key Takeaways
|
|
Our thinking and use of topology within AIOps and Observability solutions from Broadcom has advanced significantly in recent years while solidly building on our innovative domain tools.
We’re looking to communicate these innovations, advancements, and benefits for IT operations. In this blog, we continue where the previous blog left off to explain the boundary blame concept and mechanism to obtain a sufficiently complete topology.
In our previous two blogs on confident observability and incident causation, we explained why topology completeness is an all-important foundational bedrock for AIOps in terms of flow components and processing components.
In this blog we detail what completeness entails within the context of this all-important principle:
- Monitoring itself must not be the cause of issues. Monitoring must not under any circumstances have a detrimental impact on individual transactions or on overall resource consumption.
- This is particularly critical in circumstances in which a system is under fault stress or high load stress.
We detail why minimal overhead, although crucial, is not on its own a sufficient principle. Smart mechanisms must be in place to dynamically control and limit resource consumption, while obtaining transactional visibility for topology completeness.
Completeness is augmented with visibility to qualify the weighing between minimal overhead and topology completeness.
Boundary blame is detailed as a guiding monitoring concept and measure of visibility and completeness versus monitoring impact and overhead.
Monitoring for visibility
In its most simplistic form, monitoring can be done at two levels:
- Component monitoring captures component monitoring data by interrogating a component’s monitoring APIs. It also does so by monitoring a component’s environment and logs for its resource consumption and behavior, status, and health. This provides component visibility since this does not necessarily/consistently reveal transactional level details. This is why it’s denoted monitoring from the outside.
- Transactional monitoring captures transaction execution details by intercepting the execution of individual transactions within the components of a tier to capture transactions’ execution paths (caller-to-callee relationships), along with contextual details. These are aggregated into a transaction trace.
As transaction traces contain flow components and controllers with their contextual details, traces are said to provide transactional visibility. Thus, transaction monitoring (or tracing) is denoted monitoring from within and is available for components of tiers built with technology that allows for transaction interception, such as Java, .Net, NodeJS, Python, Browsers, and mobile applications.
The driver for topology completeness is visibility:
- Your visibility into your infrastructure as adequately reflected and visualized by vertices and edges of your topology and linked to metrics, alerts, and events.
- AIOps’ visibility into your infrastructure via your topology for causation and its ability to establish incident contexts for detected incidents.
- Your visibility into evidence of incidents detected (and other analytical outcomes) in topological context.
Because topology is solely synthesized from them, transaction traces are a vital data source.
Visibility for topology and incident causation
To qualify the considerations of monitoring overhead versus transaction traces for synthesizing a complete topology requirements are correspondingly detailed:
- Capture flow components, controllers, and their relationships, dependencies, and correlations:
- needed for topology vertex and edge creations
- needed for incident causation analysis
The former detail entails that repetitive traces can be omitted. The latter detail entails that only on transaction execution completion, can the need for its trace be determined. This is a most severe and critical requirement towards monitoring, as it by extension entails that all transactions must be traced.
To address this requirement, the overhead of obtaining transaction traces can helpfully be split into two distinct parts:
-
Capture: The collection of components, correlations, relationships, and dependencies with contextual details -by intercepting transaction executions to capture data for transaction traces.
-
Externalization: The sending of transaction traces into AIOps for topology synthesis and analysis.
By virtue of the lean agent’s efficiency, the capture of a trace has significantly less overhead than the externalization of a trace.
Visibility efficiency
AIOps governs the conflicting requirements of trace capture and externalization for transaction visibility and topology completeness versus minimal overhead and resource consumption as follows.
Intelligent trace capture
Extremely lean algorithms and data structures are employed within the lean agent to minimize the overhead of trace capture to allow the lean agent to capture traces for each and every transaction –they are kept internally until transactions complete:
- On the one hand, this ensures negligible impact on individual transitions and minimal resource consumption.
- On the other hand, the tracing of each and every transaction guarantees that a trace is captured for any abnormal behavior –that is, ahead of the fact it is needed.
The lean agent analyzes captured traces to dynamically adjust tracing by component inclusion to ensure they each contain a frontend and a backend as well as exit points and entry points.
The lean agent also dynamically analyzes if execution times of controllers sufficiently account for overall execution time, to adjust tracing to dynamically include more controllers until that is the case. Further, a user can set the sensitivity of this algorithm to heighten visibility or to lower overhead.
This guarantee, analysis, and mechanisms are important as they guarantee incident detection and operational guidance while protecting from excessive overhead.
Intelligent trace externalization
Integral signal and control mechanisms between monitoring agents and AIOps analytics are employed to limit the externalization to those needed for topology and causation analysis:
- Mechanisms to signal between agents the externalization of traces for downstream tiers when an incident occurs within some tier, to ensure complete externalization of spanning traces.
- Mechanisms to signal lean agents to externalize traces for components of incident contexts, when incidents are detected by AIOps’ continuous analysis of ingested monitoring data.
- Externalization of traces is tracked and eventually dynamically limited, to hinder transaction impact and excessive resource consumption.
Boundary blame minimalism
The rationale of boundary blame is to strike a balance as perfect as possible between capturing sufficient monitoring data and minimizing the cost of capture and externalization. The principle of boundary blame is to include the near optimal set of components into a topology necessary to assign incident blame (cause) within 1) a tier boundary and 2) a component within that tier:
- Determine the tier of a fault: the boundary of an incident.
- Determine the origin component of a fault: the blame component.
- Per interval metrics: Response time, executions (aka throughput), concurrency (simultaneous executions), errors, stalls (delayed completion) – aka blame metrics.
Boundary blame is best understood by considering this simple schematic depiction of the execution paths within a tier (it is simplified as trivial components are omitted):
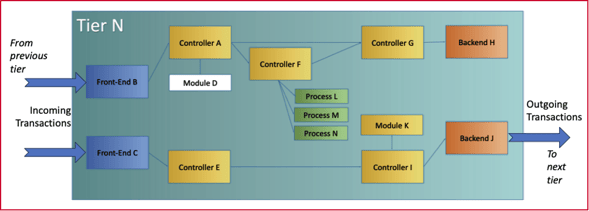
Then consider the following components (as detailed in our first blog, Topology for Confident Observability):
- Front-ends are app components where a transaction’s execution starts—B & C.
- Exit-points are app components where a transaction’s async execution forks—F↔L, F↔M, & F↔N
- Entry-points are app components where a transaction’s async execution joins—L↔F, L↔M, & L↔N
- Back-ends are app components where a transaction’s execution ends or continues in another app’s front-end or within an external service—H & J.
- Controllers are app components within the frontend-to-backend execution path that do significant processing—A, E, F, G, I. Sub-components are included to have granular visibility into significant processing, excluding trivial execution—say, K but not D.
- Blame metrics allow the determination of current problems (too high response time or errors) versus indications of brewing/developing problems (rising stalls or concurrency).
These components give coverage for all significant components of a tier (and they indirectly cover related components. As, for example, A covers D, as its execution includes execution of D).
Now, consider the call-to-callee connectedness these components entail:
The first four component types provide tier visibility into transaction execution flow by including:
- → B → H
- F ⟹ L ⟹ F
- F ⟹ M ⟹ F
- F ⟹ N ⟹ F
- → C → J →
The controller type adds visibility into processing by including:
- → B → A → D → F → G → H
- → B → A → D → G → H
- → C → E → I → J →
Coverage and connectedness ensures that any incident occurring within any component can be attributed to a tier and to a significant component within the tier. The aim of using these boundary blame component concepts is to qualify adequate topology coverage and connectedness of the ICT infrastructure.
Therefore, these components are collectively referred to as blame components.
Boundary blame is a monitoring concept that guides teams. It is also a mechanism (implemented within DX APM) that ensures transactional visibility, which again ensures topology completeness. Thus, adhering to boundary blame is a foundational paradigm for AIOps from Broadcom.
Boundary blame ensures a balanced monitoring for efficient and effective gathering of necessary and accurate data. Our advanced mechanisms to carefully capture, assemble, and externalize warranted transaction traces proves that. With AIOps, that paradigm doesn’t change.
Boundary blame is a powerful mechanism that DX APM has employed, enhanced, and refined for decades –its latest incarnation is embedded within the lean agent. It has proven that impact to monitored components can indeed be minimal and tolerable, most often negligible, to meet the demands for efficiency and effectiveness in monitoring.
As explained, the lean agent is capable of dynamically ensuring boundary blame.
Without innovative application of these concepts, either visibility suffers, cost of capture becomes untenable or both. To achieve sufficient observability in modern ICT infrastructures, striking an appropriate balance described above is even more important as it now enables advanced AIOps on complex environments.
Topology for observability assurance—Observe with confidence
Needless to say, businesses need to observe, monitor, and operate systems and services reliably with quality outcomes. Yet, many organizations lack or struggle with true end-to-end monitoring analysis. With complex systems and digital services, this is problematic for IT teams and indirectly for business teams.
ICT infrastructures constantly change as supporting technologies are added, removed, and updated to meet evolving business needs and fluid customer expectations.
AIOps from Broadcom understands the monitored environment and its dynamics, utilizing topology. The solution actively assists in continually improving observability and fostering best practices by autonomously discovering and including ICT infrastructure changes in the topology.
If you missed the prior blogs:
- Topology for Confident Observability and Digital Resilience
- Topology for Incident Causation and Machine Learning within AIOps
And coming next in our topology series, “Services for Business Observability.”
|
"In concept, topology is simple. Deriving topology and extracting trusted information from it -in real-time for complex IT estates- is enormously complex and immensely valuable." |

Jörg Mertin
Jörg Mertin, a Master Solution Engineer on the AIOps and Observability team, is a self-learner and technology enthusiast. A testament to this is his early adopter work to learn and evangelize Linux in the early 1990s. Whether addressing coordinating monitoring approaches for full-fledged cloud deployments or a...
Other resources you might be interested in
Rally Office Hours: October 9, 2025
Discover Rally's new AI-powered Team Health Widget for flow metrics and drill-downs on feature charts. Plus, get updates on WIP limits and future enhancements.
AAI - Navigating the Interface and Refining Data Views
This course introduces you to AAI’s interface and shows you how to navigate efficiently, work with tables, and refine large datasets using search and filter tools.
Rally Office Hours: October 16, 2025
Rally's new AI-driven feature automates artifact breakdown - transforming features into stories or stories into tasks - saving time and ensuring consistency.
What’s New in Network Observability for Fall 2025
Discover how the Fall 2025 release of Network Observability by Broadcom introduces powerful new capabilities, elevating your insights and automation.
Modernizing Monitoring in a Converged IT-OT Landscape
The energy sector is shifting, driven by rapid grid modernization and the convergence of IT and OT networks. Traditional monitoring tools fall short.
Your network isn't infrastructure anymore. It's a product.
See why it’s time to stop managing infrastructure and start treating the network as your company's most critical product. Justify investments and prove ROI.
The Network Engineers You Can't Hire? They Already Work for You
See how the proliferation of siloed monitoring tools exacerbates IT skills gaps. Implement an observability platform that empowers the teams you already have.
Nobody Cares About Your MTTR
This post outlines why IT metrics like MTTR are irrelevant to business leaders, and it emphasizes that IT teams need network observability to bridge this gap.
Tag(ging)—You’re It: How to Leverage AppNeta Monitoring Data for Maximum Insights
Find out about tagging capabilities in AppNeta. Get strategies for making the most of tagging and see how it can be a game-changer for your operations teams.