|
Key Takeaways
|
|
Introduction
Value stream mapping (VSMap) is an established lean management method. Through VSMap, teams can analyze the current state and design a future state, defining the series of events that take a product or service from the beginning through to when it reaches the customer. It is important to recognize that VSMap is a subset of the discipline of value stream management (VSM). Also, note that while VSMap techniques can be applied to any process domain, this discussion will be focused on the DevOps arena.
VSMap has been successfully applied to the domain of DevOps for some time. (See one example here.) Through VSMap, teams can identify bottlenecks in DevOps processes and pipelines, and help make improvements by mitigating these bottlenecks. I have conducted several dozen DevOps VSMap exercises for my customers, and these efforts have served as a key input for guiding DevOps transformations.
While performing these VSMap exercises, I have often encountered many challenges that sometimes require significant effort to overcome or that can potentially diminish the results. This blog will describe some of these challenges and reveal how artificial intelligence (AI) and machine learning (ML) techniques can be used to effectively address them.
Challenges Running VSMap Exercises for DevOps
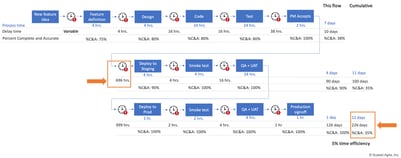
VSMap exercises for DevOps are very data-intensive processes. (See the example in the figure below, which was borrowed from Scaled Agile Framework [SAFe].) This is because we need to collect various data elements (such as process time, delay time, % complete and accurate, wait time between processes, and so on) for all of the work steps in the VSMap.
Many DevOps teams do not have this data readily available; often the data has to be collected manually from multiple sources, which slows down the exercise. Sometimes, different stakeholders have different opinions on the data. Often, we have to work with subjective estimates of the data, which can diminish the effectiveness of these exercises.
Even if teams do have the data, they realize that it is often different for various instances of the CI/CD pipeline. For example, data may vary for different micro-services that make up the application, or for each deployment in the same pipeline. Further, customers may have hundreds of CI/CD pipelines for scores of interdependent applications operating at the same time, making this an even more significant data management exercise.
Fortunately, many DevOps release orchestration or CI/CD pipeline management systems (such as Continuous Delivery Director) can be used in conjunction with Agile management systems (such as Rally) to automate the collection of the data required for each of the steps in a VSMap exercise. When we have this data, we can execute more accurate, data-driven VSMap exercises, often with significant levels of automation.
If we now apply advanced analytics and AI/ML techniques to such data, we can optimize the exercise even more. Let us explore how.
Applying Data Analytics Principles to VSMap Exercise
As it turns out, the data analytics ascendancy model created by Gartner (see figure below) provides a roadmap for how we leverage AI/ML for VSMap exercises. Let’s discuss how the different steps of the VSMap exercise align with these analytics stages, and what benefits we can derive.
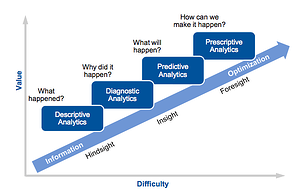
Source: Gartner, “Best Practices in Analytics: Integrating Analytical Capabilities and Process Flows,” March 27, 2012, ID: G00219139, Analyst: Bill Hostmann
Step 1 in the VSMap Exercise: Understand Current State
The first step in the VSMap process is to collect data and understand the current state. This will often require us to collect more than one data point per process in the DevOps VSMap—since each flow of software through a CI/CD pipeline may generate different data. To get a good representation of current state, we need to run some basic analytics on the data to understand things like average, mean, median, mode, standard deviation, and so on, which will help us make better sense of the data. For example, using a data distribution graph, we may reject outlier data points that may skew the VSMap exercise. All of this is the essence of descriptive analytics (identifying “what has happened”), which helps us correctly analyze current state.
With a CI/CD pipeline management tool and descriptive analytics, it is in fact possible to largely automate the generation of VSMap for DevOps, saving us the many hours of effort it takes to create maps manually. While this may initially sound insignificant, think about the ability to scale the VSMap exercise to scores of applications and hundreds of CI/CD pipelines!
Step 2 in the VSMap Exercise: Identify Bottlenecks
Once we complete the documentation of the current state, we then identify bottlenecks and other challenges in the DevOps pipeline so we can design improvements.
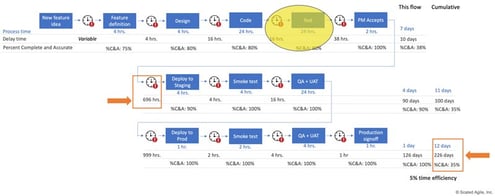
Most often, we can visually (and manually) study a VSMap and identify the top bottlenecks. For example, in the VSMap we borrowed from SAFe, we can see that the initial testing process (after coding) is a bottleneck since it takes more than 24 hours to execute and there is 16 hour hand-off time between code and test stages. These lengthy stages impede the fast feedback developers need after they commit code. We then need to dig deeper to understand why the test cycles are long and why there is such a large hand-off time. This needs to be done manually since a VSMap does not explicitly capture this information.
Using data analytics, we could easily automate the identification of such bottlenecks. However, the real power of analytics lies in automatically unearthing why the bottleneck is occurring. This is exactly where diagnostic analytics come in—helping us identify “why it happened.” For example, by analyzing the underlying data from the testing process, the analytics may indicate that this is due to a number of factors, including:
- Manual, time-consuming testing efforts.
- Automated tests are taking a long time to execute, for example, because tests are hanging or aborting and re-starting.
- Testers are spending a lot of time manually entering voluminous defects found from tests.
- The fact that we are over-testing.
Similar automated analysis may be run for other types of bottlenecks, which would otherwise require significant manual work.
Sometimes, when doing visual bottleneck analysis, looks can be deceiving, and the real bottleneck may actually lie elsewhere. For example, it could be that that the lengthy handoff time between code and test (in the illustration above) is a problem created in the design phase. Maybe the test environment setup requires provisioning of physical application components, because they were not isolated enough be virtualized. Or, maybe test data design and specification was not completed in the design phase.
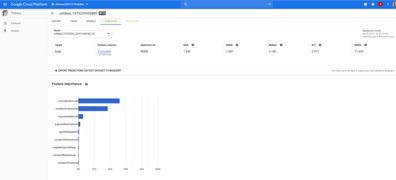
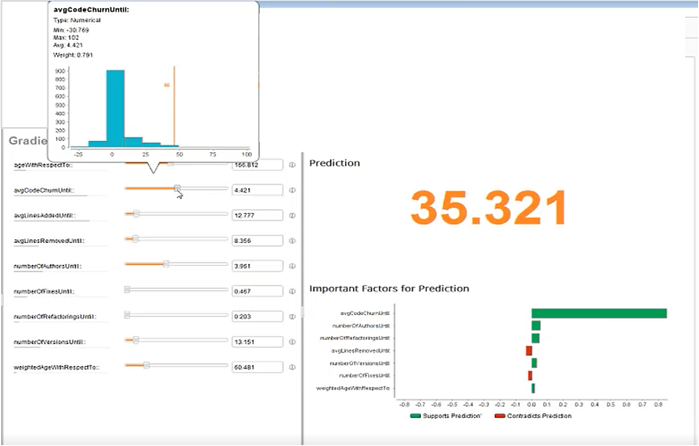
In other cases, the root cause is not easily determinable. Let’s say, for example, we have a significant defect escape rate, which is an impediment for product quality. Using diagnostic analytics, we may be able to determine why this is happening—such as due to significant code churn. I ran these sample diagnostics (see the figure below) using Google Analytics. I did so by defining an analytics model and using a gradient boosted tree to correlate defect leakage with other pre-production data. These diagnostics showed a significant correlation between defects leaked and the code churn for an application.
With diagnostic analytics, then, it is in fact possible to do intelligent automated bottleneck analysis to accurately identify areas for remediation. Automated bottleneck analysis allows us to scale the exercise, while reducing effort.
Step 3 in the VSMap Exercise: Identify Opportunities for Improvement
Once we understand what the bottlenecks are and why they are occurring, we can identify opportunities for improvement. In a VSMmap exercise, we are likely to uncover multiple opportunities that we then need to prioritize for enhancement. In many cases, this may be done using a simple benefit-vs-cost analysis.
In some cases, however, this analysis is not that simple, and it is difficult for us to predict which improvements will yield the desired results and by how much. For example, I have often observed that simply cutting down elapsed testing time does not proportionately affect the overall deployment cycle time. Often, other factors, such as cutting down deployment times, while appearing to be less of a bottleneck on a VSMap, have greater impact on reducing cycle time.
This is where predictive analytics (“what will happen”) could be very useful in anticipating the impact of different improvement ideas. For example, I used the analytics model described in the previous section to predict how defect leakage would change if we altered the code churn (see figure below). Similarly, we can do “what-if” predictive analytics to precisely understand the impact of different remediation actions, and deduce which would yield the best results.
Step 4, a Follow-up to the VSMap Exercise: Execute Improvements
Once we understand what the high impact opportunities for improvement are, we need to execute those improvement ideas. Here’s where we look to prescriptive analytics (“how can we make it happen”) to guide us.
Generally speaking, these recommendations would be closely related to the factors identified in the previous step. For example, extending the scenario from above, by defining rules in which we test more thoroughly when we have higher code churn in a build, we may be able to increase defect detection and reduce defect leakage.
However, there are many situations in which certain combinations of improvements—implemented at different levels—may yield the best results versus implementing a thorough remediation of the biggest bottleneck. For example, it could be a combination of service virtualization (to improve unit testing), deployment automation, and some optimizations of the test phase that yields the best improvement in deployment cycle time. Prescriptive analytics excel at helping with this type of decision making by automating various combinations of predictive scenarios.
Evolving from VSMap to Continuous VSMap
We can see how we can effectively use data analytics and AI/ML to significantly improve VSMap exercises—both in terms of efficiency and effectiveness. However, the real enduring value of applying this approach in my mind is being able to do VSMapping “continuously”—in keeping with the DevOps principle of “continuous everything.”
Because of the effort and other challenges that are involved in doing VSMap exercises, we tend to do them infrequently. If we can automate most of the VSMap process using AI/ML as discussed above, we may be able to do this exercise continuously—and even autonomously—as part of our DevOps pipeline management.
At the end of every deployment, or some set number of deployments, analytics engines could run to collect data, analyze it, identify bottlenecks and opportunities, and generate a trigger for recommended remediation actions. We may even be able to perform some level of automated remediation or healing. For example, we may be able to automatically update the build promotion or test coverage rules, depending on the latest state of pipeline execution.
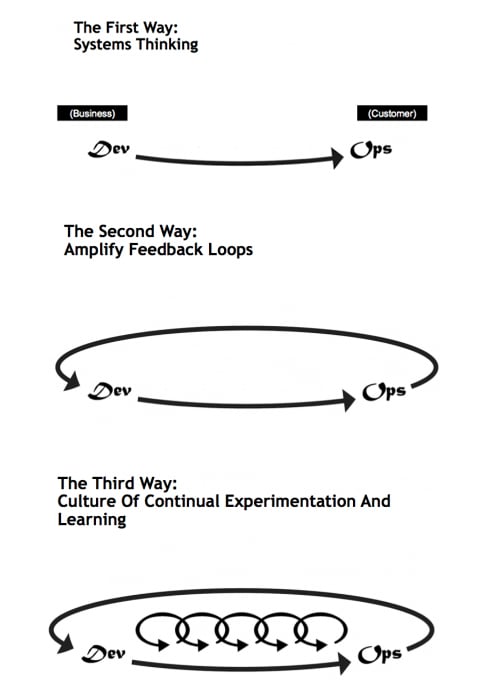
This enables us to continuously optimize our DevOps pipelines based on the latest state of execution. This is in fact a realization of the “Third Way” of DevOps as defined by Gene Kim—the establishment of a culture of continual experimentation and learning (see figure below).
I am really excited about how AI/ML can be applied to DevOps specifically and to the discipline of VSM more generally. In a future blog, I will discuss applications of AI/ML to the larger domain of VSM. In the meantime, to learn more about the latest trends in VSM, be sure to check out all the informative, on-demand presentations from our Value Stream Management Summit.
Tag(s):
ValueOps

Shamim Ahmed
Shamim is a thought leader in DevOps, Continuous Delivery, Continuous Testing and Application Life-cycle Management (ALM). He has more than 15 years of experience in large-scale application design and development, software product development and R&D, application quality assurance and testing, organizational quality...
Other resources you might be interested in
Rally Office Hours: July 16, 2026
This July 16, 2026 Rally Office Hours session highlights a new custom pages substitution variable, custom page migration updates, and community Q&A.
Controlling Flow Telemetry Overhead in Distributed Environments
See how the latest updates to NetOps Flow reduce telemetry overhead and optimize WAN usage. Simplify data extraction and integration with the OData 4 API.
Clarity: Managing Reports
This course is designed for report consumers who need to access, analyze, and manage published reports in Clarity.
Automic Integration Brochure
This brochure serves as your guide to the diverse tools, platforms, and systems that can connect seamlessly with Automic.
Clarity: Configure Reporting Data Sources Using Data Providers
This course explains the data foundation that supports Reporting in Clarity. Learn how Data Providers prepare, organize, secure, and validate reporting data.
Rally Office Hours: July 9, 2026
This session covers the general availability of milestone delivery confidence, troubleshooting for custom views and admin functions, and upcoming webinars.
Network Observability NCM
See how Network Observability NCM delivers network configuration management capabilities that automate remediation, ensure compliance, and mitigate risk.
Rally Office Hours: July 2, 2026
Explore the July 2, 2026, Rally Office Hours session covering OAuth security updates, the new portfolio item flow states beta, and upcoming event news.
Unleashing Enterprise Agility: The Power of Portfolio Kanban Flow States
Learn how Rally's Customizable Portfolio Item Flow States (PIFS) balance team autonomy with executive visibility to accelerate enterprise value delivery.