
|
Key Takeaways
|
|
For IT operations teams, syslog messages continue to be a vital source of intelligence for network events. By tapping into this data, teams can manage their environments more efficiently and effectively. In this post, we offer an introduction to syslog, and examine how DX NetOps enables teams to fully harness the intelligence from this data.
What is syslog?
Syslog can provide key insights into potential network faults. In fact, for some specific types of network events, syslog is pretty much the only game in town.
Syslog was developed back in the 1980s. The standard enables the separation of the software that generates the messages, the system that stores the messages, and the software that is used to report and analyze the messages.
Traditionally, syslog has used the User Datagram Protocol (UDP) to transfer messages in clear text, and this remains the most common standard in use. Later standards also enabled teams to use Transmission Control Protocol (TCP) to enable more reliable transmission, and Transport Layer Security (TLS) to send messages in an encrypted format.
Today, the syslog standard is employed in a wide range of systems, including such network devices as routers and switches, as well as servers and printers.
Syslog data format
While often referred to as unstructured data, the reality is that all vendors employ a semi-structured approach to syslog. Syslog messages come in a standard format that includes several key elements:
- Facility code. The facility code identifies the name of the program or process that generated the message.
- Severity. Messages also include a severity level, which a network operating system vendor will define. In contrast, with SNMP traps, network management tools and administrators need to figure out severity.
- Content. Finally, the message features a content element with event details.
All vendors use a standard format for header information, which includes source IP address and priority. The header also includes a time stamp for when a message came from a device and when a syslog server received it. In addition, some vendors provide a more verbose text string about the message, including the service that the device is providing, and a short description of the nature of the event, such as an up/down event, adjacency change, or memory error.

Example of Syslog message showing duplex mismatch on an Ethernet interface
Solution
Through DX NetOps, teams can most fully leverage the power of syslog messages, so they can more quickly and efficiently identify and address network faults. With the solution, teams can leverage these key capabilities:
- Use syslog events to generate alarms or incorporate into event rules and workflows.
- Take advantage of deduplication and correlation to reduce alarm noise.
- View syslog alarms in context with devices to drill down to spot root cause and symptoms.
How it works
DX NetOps features integration with Rsyslog, a popular open-source syslog tool that ships with most versions of Linux. This integration enables the solution to ingest syslog events from all network devices that generate compliant syslog data.
The solution employs a module on the syslog server that converts syslog messages to SNMP traps. Then DX NetOps processes syslog data using native SNMP trap handling. Teams can deploy the solution in a fault tolerant environment, sending syslog feeds to multiple destinations, such as primary and secondary receivers, for redundancy.
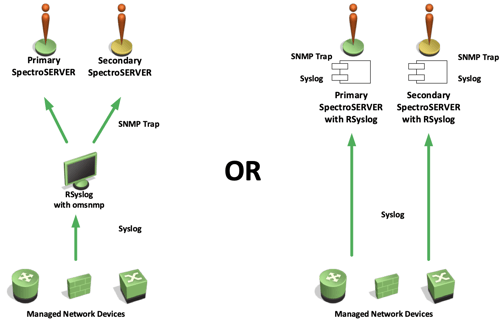
Examples of RSyslog integrated with DX NetOps in a fault tolerant environment
While not designed for log analytics, this integration does enable teams to have only actionable logs sent to DX NetOps for alarm generation and event processing. At the same time, all logs can be sent to an analytics solution, whether from Broadcom or a third party.
Tokenizing and parsing
DX NetOps offers the ability to tokenize and parse syslog messages, so teams can extract more value from this data. The solution reads syslog feeds in real time and sends matching log events to the DX NetOps server to process those events.
The solution can look at the message body, generate a specific event, and extract event variables, for example, to pick out interface name, BGP neighbor, and so on. Teams can then use these variables as part of event rules within DX NetOps, as with data from other feeds. For example, if a BGP peer session is down, the solution can generate an alarm. If the session comes back up, it can clear an alarm.

Example of tokenizing and parsing the %LINK-3-UPDOWN syslog message
Proven scalability
The DX NetOps and Rsyslog integration has been in production for more than five years, and has been proven to be highly scalable in customer environments. For example, one customer is using the solution to process approximately 25 million events per day, with many more syslog messages being filtered, forwarded, and logged.
Conclusion
As IT operations teams look to speed troubleshooting and remediation, syslog messages represent a vital resource. With DX NetOps, teams can gain the capabilities they need to maximize the potential of the syslog messages being generated in their environment.
To learn more, be sure to watch our Small Bytes session, How to Utilize Syslogs for Improved NetOps Visibility. Our Small Bytes series offers practical examples and strategies for getting the most from Broadcom solution investments. Visit our Small Bytes page to see a complete list of upcoming and on-demand presentations in the series.

Robert Kettles
Robert Kettles started off as a field engineer at Cabletron Systems supporting LAN/WAN switching and routing solutions along with their relatively new network management platform: Spectrum. Over two decades later, he continues to help customers solve network fault and performance management challenges.
Other resources you might be interested in
Automic Automation: Transition to SAP RISE with Confidence
Automic Automation safeguards Clean Core architecture, mitigates SAP RISE migration risks, and unifies enterprise scheduling from mainframe to cloud.
AutoSys Workload Automation: Transition to SAP RISE with Confidence
AutoSys safeguards Clean Core architecture, mitigates SAP RISE migration risks, and unifies enterprise workload scheduling from mainframe to cloud systems.

AppNeta: Manage Alarm Rules
Learn how to create and manage alarm rules in AppNeta. Detect, isolate, and present user-impacting issues to network operations center teams.
Rally Office Hours: October 8, 2026
Find out about a new “my notifications” widget and an enhanced planned/unplanned widget. Hear about diverging axis views and upcoming cycle time widgets.

Going Off-Road: How We Bulletproofed Automic's Zero Downtime Upgrades
To ensure absolute reliability at SaaS scale, Automic Automation recently evolved its ZDU strategy.
Rally Office Hours: October 1, 2026
Explore Rally updates, including end-to-end markdown support, a new defect trend widget, an update dependency widget, and custom view migration status.
Clarity: Design Visual Layouts Using Report Designer
This course teaches you how to create new reports with the Clarity Report Designer.
Rally Office Hours: September 24, 2026
Find out about a new milestone cumulative flow diagram widget and custom view widget capacity. Get tips for handling project name changes in middleware.
Rally Office Hours: September 17, 2026
Explore Rally's new delivery confidence feature for portfolio items, hear custom view migration updates, and get expert answers to Q&A.