|
Key Takeaways
|
|
If you're feeling like your network operations just keep getting more complicated, you're not wrong. One of the core promises of cloud models was improved simplicity. However, the ensuing reality for your network operations teams has been anything but simple.
Suddenly, users and applications are everywhere. Traditional, on-premises equipment now coexists with software-defined wide area networks (SD-WANs), cloud-hosted resources, and hybrid connections that hop across public and private networks. It’s no surprise that demand for SD-WAN has exploded—it's built for exactly these types of cloud and hybrid environments. But here’s the thing: with SD-WAN comes complexity. A lot of it.
Take a relatively simple enterprise environment with two data centers and 100 branches. Traditionally, you might have around 200 paths to manage. But once you layer in SD-WAN? That number doesn’t just grow—it skyrockets. You could be looking at more than 7,500 network paths. That’s more than a 35-times increase, and suddenly, what was once a manageable environment threatens to devolve into operational chaos.
The tools that once worked are stretched to the limit—and you're still expected to keep everything running smoothly. Particularly in large enterprise environments, teams are struggling to establish unified, full-mesh views. Without complete, actionable visibility, teams are left in fire-fighting mode, while the organization remains exposed to outages and performance issues that exact a steep cost on the business.
It's time to bring order to the chaos.
Solution: DX NetOps Topology gives you visibility to gain control
With DX NetOps, network operations teams can centralize day-to-day operations to boost efficiency and control, whether their organizations are running traditional equipment, new SD-WAN technologies, or a mix of everything.
Now, DX NetOps Topology is available, offering scalable and user-friendly network visualizations that make network operations easier, more efficient, and more effective.
In a prior blog post introducing DX NetOps Topology, we discussed the powerful capabilities of DX NetOps Topology, offering a high-level overview of how it helps simplify network management across traditional and modern environments. In this post, we’ll focus on how it helps with one of the toughest challenges network operations teams are currently confronting: getting control of SD-WAN.
Here are a few key features of the solution.
Correlated visibility
SD-WAN doesn’t just create more connections—it creates more layers to track. With DX NetOps Topology, you get a complete, correlated view of your environment, including both control plane and data plane insights. You can see every connection, every tunnel, and every hop—no matter how many sites you’re managing.
More importantly, you’re not stuck looking at noise. The tool intelligently segments views by region, so you can focus on what matters without getting overwhelmed. And this isn’t some static dashboard. It’s fully interactive. You can dig in, pivot around, and zoom out to get exactly the level of detail you need.
Actionable, targeted insights
DX NetOps Topology provides visualizations that help enhance troubleshooting and enable operators to manage SD-WAN environments more effectively. In large SD-WAN deployments, you might have hundreds or even thousands of tunnels. Finding the one that’s causing issues can feel like searching for a needle in a haystack.
That’s why the filtering capabilities in DX NetOps Topology are a game changer. You can filter by region, severity, transport type, or protocol. Within seconds, you’re looking at just the tunnels that matter.
Extensive coverage
DX NetOps offers support for a range of software-defined technologies, including Cisco ACI, Cisco Catalyst Center, Viptela, VMware NSX, and more.
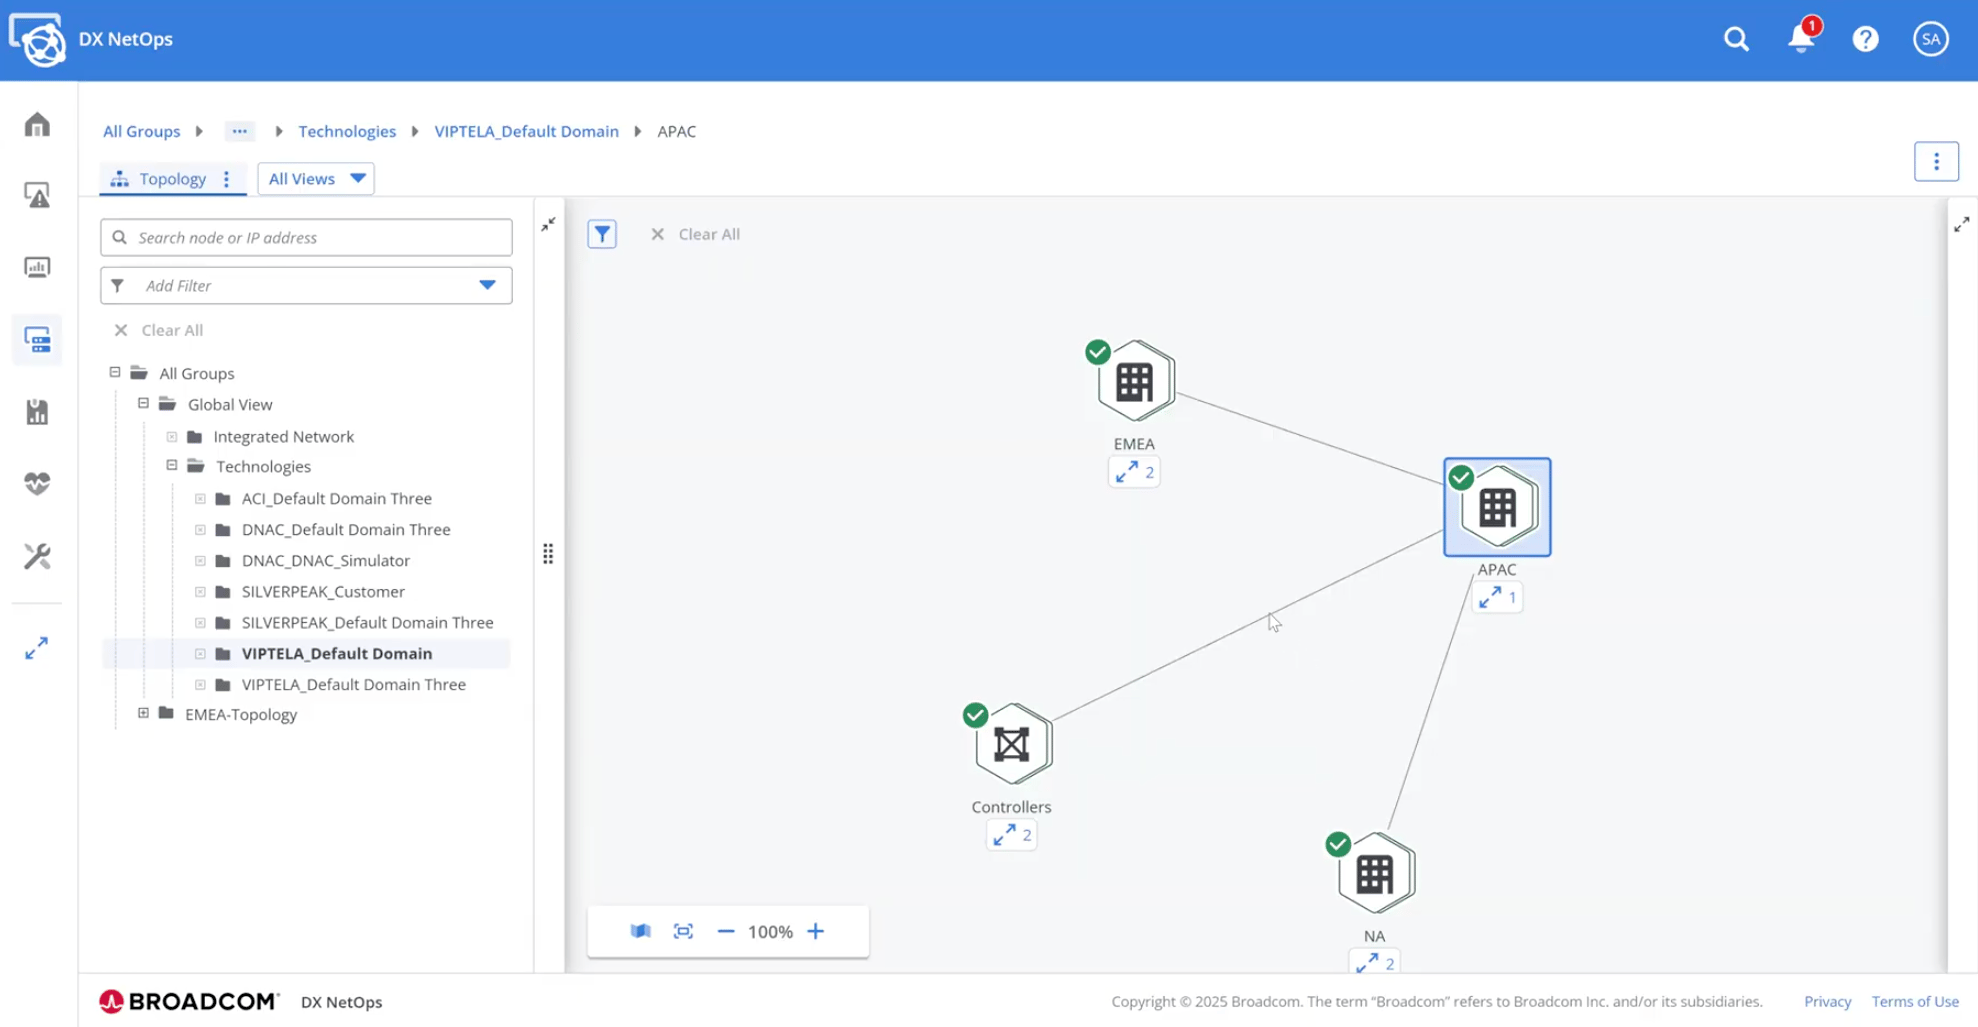
Sample scenario #1: Troubleshooting issues that span regions and sites
Let’s say you're a network engineer trying to resolve latency issues being reported in two different corners of the globe—one site in Asia and another in North America. You’re seeing high latency, but the root cause isn’t immediately clear. Is it the WAN connection? An overloaded edge device? A misbehaving tunnel?
With DX NetOps Topology, you don’t have to guess—you can go straight to the source.
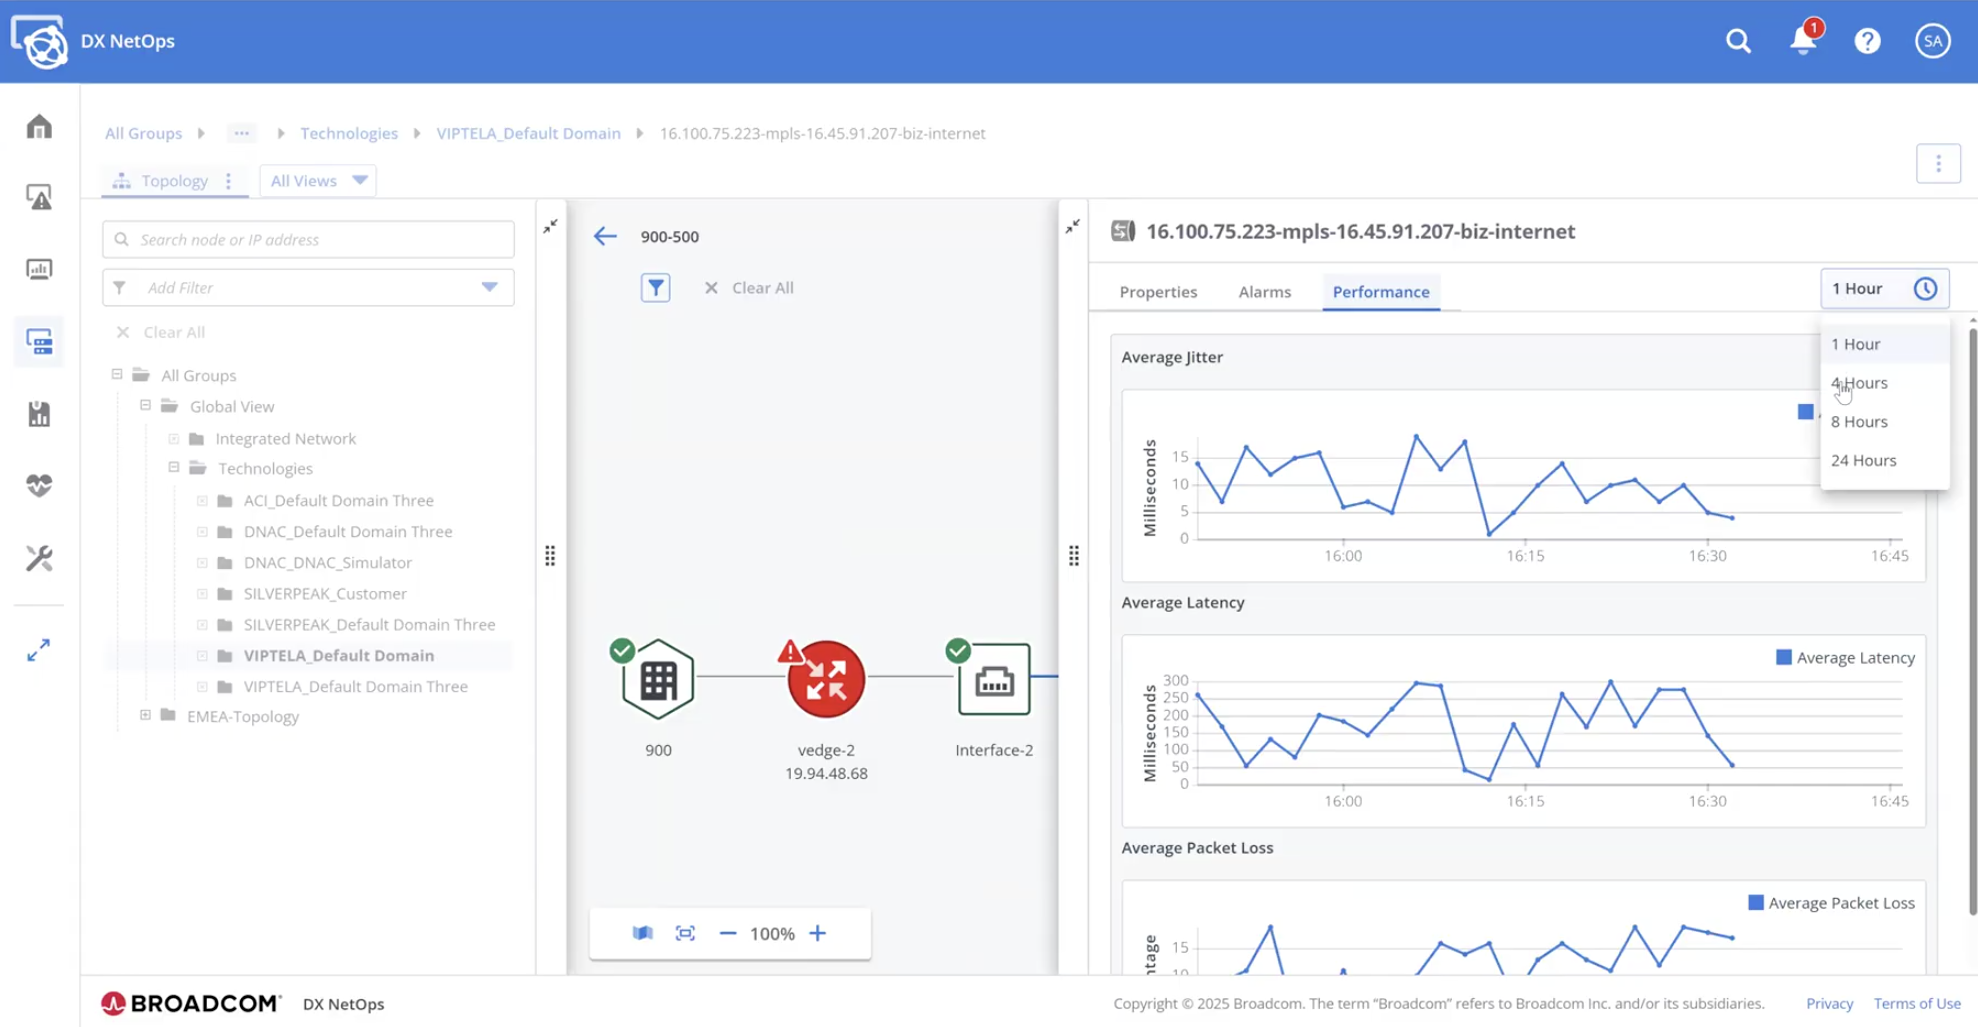
In just a few clicks, you can drill down into the data plane connectivity between these two regions. From a single view, you see the edge routers, dynamic tunnels, and all associated sites. Better yet, you get visibility into the physical ports and the real-time tunnel data—all in one detailed pane in the same window.
Now you can immediately determine whether the problem is isolated to a specific tunnel or part of a broader performance problem. And because the platform correlates performance and fault data automatically, you can validate your findings with supporting metrics. Whether it's high jitter, persistent packet loss, or a hardware fault, DX NetOps Topology presents the correlated fault attributes and performance stats together, making root cause analysis faster and more accurate.
Sample scenario #2: Isolating problematic tunnels in large, multi-region SD-WAN deployments
Now, imagine you’re responsible for operating a large-scale SD-WAN deployment with dozens of regions and thousands of tunnels. You’ve been alerted to performance degradation somewhere in the network—but where do you even begin?
This is where DX NetOps Topology’s filtering capabilities shine.
When zooming in on site-to-site connectivity, it’s not uncommon to see dozens of tunnels configured for redundancy and performance optimization. But manually sifting through hundreds of tunnels to find the one with issues? That’s a time sink no one can afford.
With DX NetOps Topology, you can apply filters instantly—by region, country, tunnel severity, transport type, or protocol—and in seconds get the exact set of connections you need on screen. For example, you can quickly visualize all tunnels between sites in EMEA and North America, or zero in on tunnels flagged with critical latency issues.
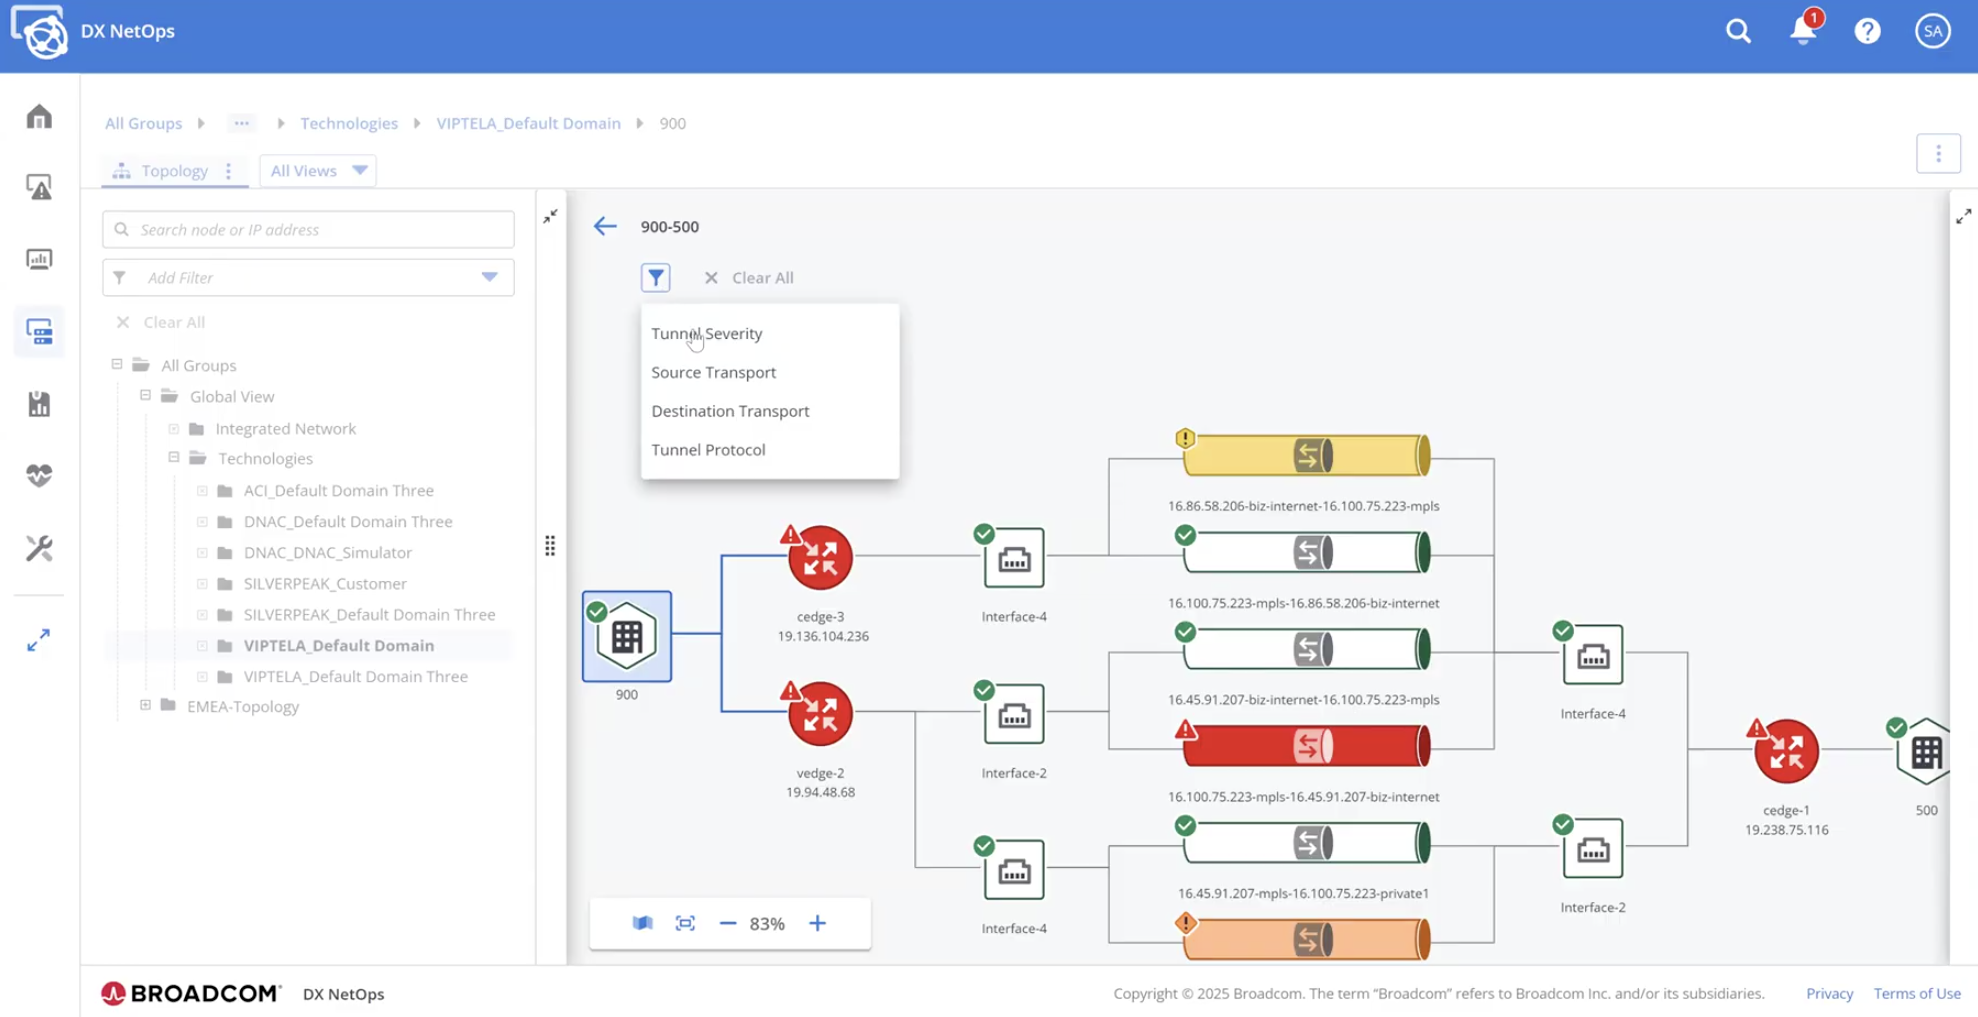
Need to dig deeper? You can instantly pivot to check control plane connectivity, persistent tunnel health, and status across regions. And if it turns out the problem isn’t isolated to one tunnel, you’re already set up to scan the rest of the region without having to reconfigure your view.
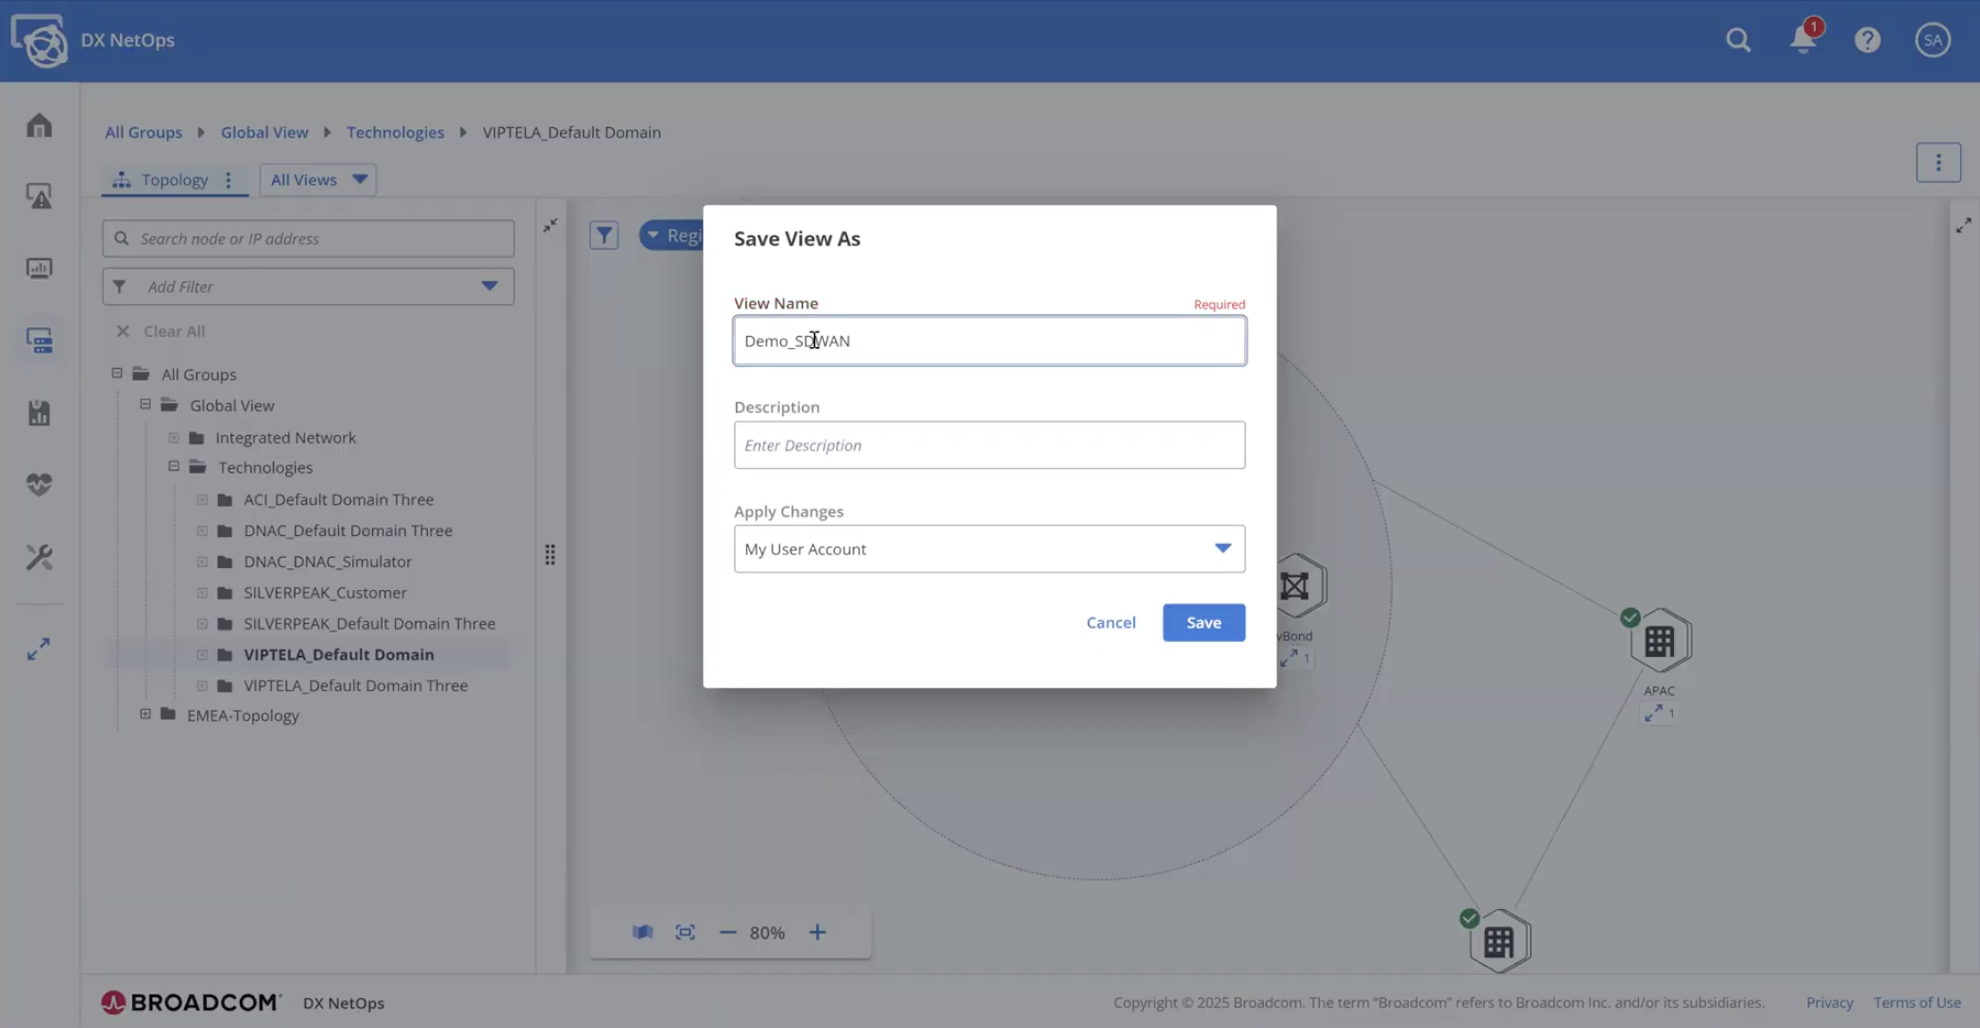
To make operations even smoother, DX NetOps Topology lets you save these filtered views. So the next time you're working through a similar troubleshooting scenario—or conducting a routine check—you can pull up your saved view and get to work immediately. It’s fast, consistent, and reduces the chance of human error.
Conclusion
SD-WAN isn’t going away. If anything, the complexity introduced by SD-WAN is becoming the new normal. And as the networks we manage grow more complex, we need tools that can simplify operations—without sacrificing control. DX NetOps Topology enables you to do just that. With the solution, you can:
- Visualize full SD-WAN topologies across sites, regions, and vendors.
- Drill down into control and data plane performance with correlated metrics.
- Apply fast, flexible filters to isolate tunnels and pinpoint issues.
- Save and reuse custom views to streamline future investigations.
At the end of the day, DX NetOps Topology gives network teams what they really need: clarity, speed, and control.
To learn more, be sure to view our recent Small Bytes webcast, Unlocking SD-WAN Insight with DX NetOps Topology. This webcast examines the challenges posed by modern SD-WAN environments, and it reveals why DX NetOps Topology is such a game changer. In addition, you can view the webcast to see a demonstration of the solution in action.

Sandeep Tiwary
Sandeep Tiwary is a product manager for network operational intelligence for AIOps solutions at Broadcom. He has a deep understanding of and expertise in cloud technologies, along with more than 16 years of experience building and marketing software products and services. He is currently driving customer-centric...
Other resources you might be interested in
Controlling Flow Telemetry Overhead in Distributed Environments
See how the latest updates to NetOps Flow reduce telemetry overhead and optimize WAN usage. Simplify data extraction and integration with the OData 4 API.
Clarity: Managing Reports
This course is designed for report consumers who need to access, analyze, and manage published reports in Clarity.
Automic Integration Brochure
This brochure serves as your guide to the diverse tools, platforms, and systems that can connect seamlessly with Automic.
Clarity: Configure Reporting Data Sources Using Data Providers
This course explains the data foundation that supports Reporting in Clarity. Learn how Data Providers prepare, organize, secure, and validate reporting data.
Rally Office Hours: July 9, 2026
This session covers the general availability of milestone delivery confidence, troubleshooting for custom views and admin functions, and upcoming webinars.
Network Observability NCM
See how Network Observability NCM delivers network configuration management capabilities that automate remediation, ensure compliance, and mitigate risk.
Rally Office Hours: July 2, 2026
Explore the July 2, 2026, Rally Office Hours session covering OAuth security updates, the new portfolio item flow states beta, and upcoming event news.
Unleashing Enterprise Agility: The Power of Portfolio Kanban Flow States
Learn how Rally's Customizable Portfolio Item Flow States (PIFS) balance team autonomy with executive visibility to accelerate enterprise value delivery.
Chart Your Team’s Analytics Journey with Customizable Dashboards in DX NetOps
DX NetOps now features customizable dashboards, providing standards-based flexibility and an easy way for new and existing users to add custom dashboards.