February 9, 2024

A practical example of end-to-end network troubleshooting, from cloud to data center.
|
Key Takeaways
|
|
Networks are becoming more elastic, flexible, and agile than ever before. Organizations can now run network functions on commodity hardware, making network design and implementation less rigid and expensive. By modernizing and virtualizing their networks, teams are able to increase capacity and improve security.
However, these improvements come at a price: An EMA study showed that the percentage of network operations teams that are successfully meeting their overall missions has declined from 47% in 2018 to 27% in 2022.
This powerful stat underscores the level of complexity that networks are moving towards. This complexity has a significant impact on network operations, making it more difficult and time consuming to isolate the root cause of issues and reduce mean time to repair (MTTR).
This blog post will explain how to troubleshoot issues in modern networks in five easy steps. The post will walk through an example of how a network operations team can use DX NetOps by Broadcom to determine the root cause of a network degradation issue that affected users accessing a cloud application.
1. Receive proactive notification of degraded connectivity to a cloud application
As is often the case for teams in network operations centers (NOCs), the troubleshooting process starts with a network event. In this case, AppNeta has generated a network delivery event relating to a SaaS-based Teams application.
This alarm has been generated via active network testing, and it indicates that users located in Europe are experiencing data loss when connecting to the Teams application.

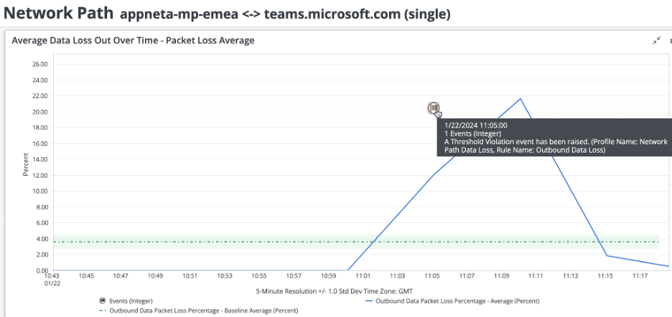
Figure 1. Unified alarm console and dynamic alarms on user experience metrics
There is huge value in bringing network experience metrics into the NOC console, as it helps operators to understand the impact of network degradation on end customers or users.
These network experience insights expand visibility beyond corporate boundaries. With AppNeta, teams can track user experience from any location to any target (including SaaS and cloud environments) and over any network (including on-premises, ISP, CSP, or wireless).
In the next section, we’ll explore how the NOC operator can find the root cause of this issue.
2. Validate SD-WAN health
In the previous step, AppNeta had employed active monitoring to detect a network degradation for users in Europe who were connecting to Teams. The issue was then presented in the DX NetOps portal.
In this example, the organization uses cost-effective SD-WAN technology to enable user connections to cloud and SaaS apps. The NOC operator can start troubleshooting by validating the health of the SD-WAN.
From the solution’s SD-WAN dashboard, the NOC operator can quickly validate that the SD-WAN is healthy, both from an underlay and overlay point of view.
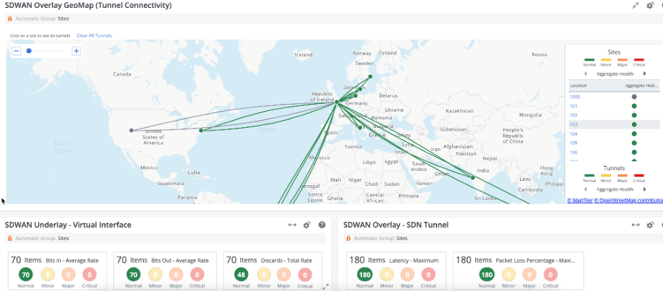
Figure 2. Unified view of SD-WAN health, including tunnels, edge devices, and ports
This validation is made possible thanks to the vendor agnostic SD-WAN capabilities that DX NetOps delivers. In a single portal, the solution provides intelligent views and unified support across multi-vendor software-defined networks, reducing tool sprawl and streamlining operations.
3. Use AppNeta to isolate the error domain
In the prior step, the NOC operator determined that SD-WAN wasn’t responsible for the data loss issue users experienced when connecting to Teams.
Next, the NOC operator clicks on the network path that has been affected, seeking to determine why Teams performance is degraded for users in Europe.
With a single click, the operator gets end-to-end visibility into the health of the network delivery path, from a single portal, dramatically speeding detection.
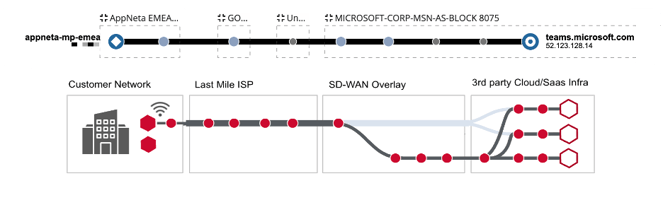
Figure 3. Network path visibility from the user to the cloud
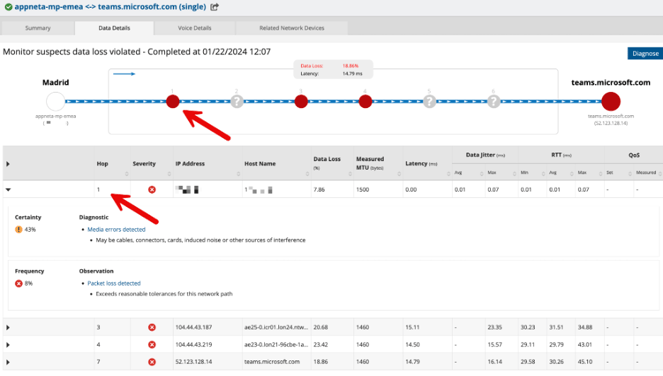
Figure 4. AppNeta root cause isolation
The graphics above show how AppNeta network path diagnostics clearly reveal that the data loss is happening at the very first hop of the network path.
In a matter of minutes, the NOC operator has determined that the WAN and SaaS environments are not the cause of the problem. The operator then focuses attention on that first node, which is located in the data center.
Note the business value of AppNeta at this stage. The solution provides extended reach into edge services, multi-cloud environments, and ISP networks. AppNeta delivers visibility into every communication path and degradation point, from the core network to the end user.
4. Inspect contextual performance, flow, and configuration information to determine the root cause
After looking at network path performance data provided by AppNeta, the NOC operator has isolated the issue to a specific access switch.
Next, from the DX NetOps portal, the operator clicks on the problematic node and quickly validates that Teams flows are traversing it. In the process, the operator validates that the switch’s performance is not a problem.
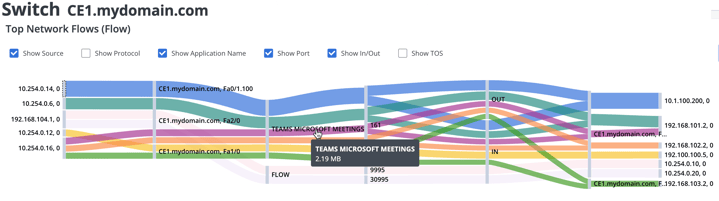
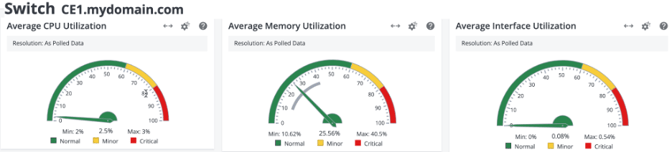
Fig 5: Flow and Performance data in context
At this point, the NOC operator has cleared SD-WAN, SaaS, and device performance as the root cause of the issue.
The operator then notices that there is a configuration change alert on this access switch and drills down in context to understand why and when this change happened.
![]()
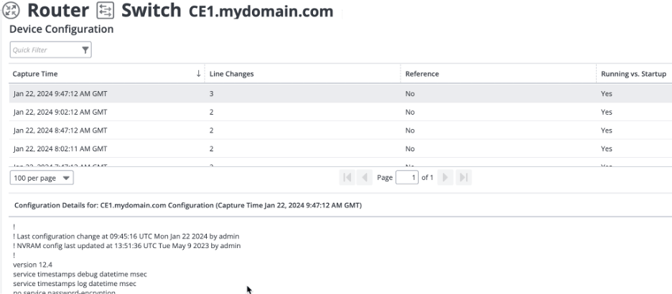
Figure 6. Network Configuration Management from DX NetOps
The operator can see a routing change has been implemented on this device in the last few hours. This change introduced the data loss issue in this access router, which had an impact on users at this site who were accessing cloud applications like Microsoft Teams.
A ticket is created that features rich contextual information and configuration rollback is initiated. After a couple of minutes, the NOC operator can inspect the same network path and confirm that performance has been restored.
The NOC operator has been able to do efficient troubleshooting with easy, scalable access to a plethora of rich, contextual data. The data is collected in a vendor-agnostic fashion from multiple domains via different mechanisms, including SNMP, APIs, network telemetry, and synthetic testing. Then this data is correlated by DX NetOps to reveal relevant insights for quality tickets, all from a single solution.
5. Automate remediation workflows for self-healing
As a final step, our NOC operator can leverage the multiple options available in the solution to trigger automated remediation workflows. These workflows can range from simple health checks invoked via webhook calls to the repair of non-compliant device configurations, such as the issue featured in this example.
Below is an example of different workflows that can be triggered from DX NetOps insights.
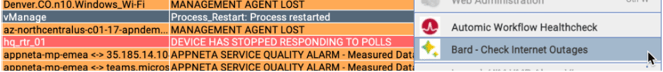
Fig 7: In context workflows to be invoked from DX NetOps
Automation is increasingly crucial as teams look to achieve operational excellence. DX NetOps offers a range of capabilities for establishing automation. The solution facilitates self-healing by delivering actionable insights and enabling integrations with multiple platforms.
Conclusion
This blog post has walked through a practical example of how teams can quickly and effectively troubleshoot and resolve issues in modern networks, which now include an increasingly complex mix of cloud, SD-WAN, and data center environments.
This example reveals how DX NetOps can deliver complete coverage of network performance, offering visibility that extends beyond corporate boundaries. The solution delivers intelligent analytics from next-generation network technologies. By consolidating coverage of faults, performance, topology, software-defined networks, and user experience, the solution enables teams to standardize around a single, unified platform.
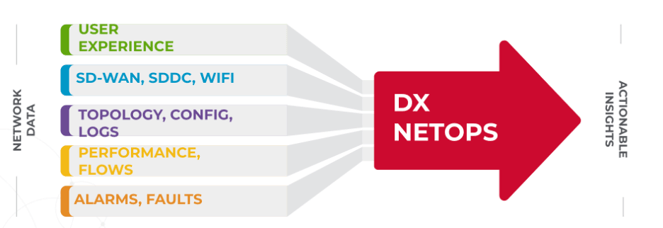
Figure 8. DX NetOps by Broadcom
Learn more about DX NetOps, a unified platform that enables end-to-end, holistic network observability and management across domains and vendor technologies. With these capabilities, the solution can help teams break down silos and reduce operational complexities.
Nestor Falcon Gonzalez
Nestor holds a Master's Degree in Telecommunication Engineering and has over 20 years of experience in Telco, Network and Infrastructure Operations in different roles: SWAT, pre-sales and Solution Architect. He focuses on helping customers on their network transformation, driving innovation and providing value for...
Other resources you might be interested in
Controlling Flow Telemetry Overhead in Distributed Environments
See how the latest updates to NetOps Flow reduce telemetry overhead and optimize WAN usage. Simplify data extraction and integration with the OData 4 API.
Clarity: Managing Reports
This course is designed for report consumers who need to access, analyze, and manage published reports in Clarity.
Automic Integration Brochure
This brochure serves as your guide to the diverse tools, platforms, and systems that can connect seamlessly with Automic.
Clarity: Configure Reporting Data Sources Using Data Providers
This course explains the data foundation that supports Reporting in Clarity. Learn how Data Providers prepare, organize, secure, and validate reporting data.
Rally Office Hours: July 9, 2026
This session covers the general availability of milestone delivery confidence, troubleshooting for custom views and admin functions, and upcoming webinars.
Network Observability NCM
See how Network Observability NCM delivers network configuration management capabilities that automate remediation, ensure compliance, and mitigate risk.
Rally Office Hours: July 2, 2026
Explore the July 2, 2026, Rally Office Hours session covering OAuth security updates, the new portfolio item flow states beta, and upcoming event news.
Unleashing Enterprise Agility: The Power of Portfolio Kanban Flow States
Learn how Rally's Customizable Portfolio Item Flow States (PIFS) balance team autonomy with executive visibility to accelerate enterprise value delivery.
Chart Your Team’s Analytics Journey with Customizable Dashboards in DX NetOps
DX NetOps now features customizable dashboards, providing standards-based flexibility and an easy way for new and existing users to add custom dashboards.