|
Key Takeaways
|
|
Private cloud solutions like VMware Cloud Foundation (VCF) are rapidly gaining traction as organizations seek the benefits of on-premises control with cloud-enabled agility. While these offerings deliver significant benefits, they also introduce significant challenges for network operations teams striving to maintain optimal user experiences.
The challenges of private cloud network operations
The shift to private and hybrid cloud environments, while beneficial, amplifies existing network complexities. Network teams are grappling with limited visibility, fragmented monitoring tools, distributed infrastructure, and an ever-increasing volume of virtual circuits and devices. Let’s dive into these challenges:
- Limited visibility. Communications rarely stay contained within your private cloud. Typically, critical business services rely on connectivity paths that traverse third-party environments, including ISP networks, cloud infrastructure, and inter-cloud backbones. You're essentially blindfolded in these external domains, which makes troubleshooting, performance monitoring, and even basic diagnostics incredibly difficult.
- Fragmented monitoring tools. Over the years, specialized tools have proliferated alongside emerging technologies. In VCF environments, teams often rely on VMware Aria Operations for Networks (formerly known as vRealize Network Insight [vRNI]). While valuable, these tools offer a limited perspective of the end-to-end connectivity paths that your services depend on because they focus only on the virtual network environment. The result? Operators are forced to collect, correlate, and analyze data from disparate sources—a time-consuming and error-prone process. For example, imagine an operator finds out about a specific event at 12:30. They then have to do the detective work of determining where the issue arose, whether the issue was caused by an upstream system, whether it impacts downstream services, and more. This makes prioritizing alerts and resolving issues a slow and arduous process.
- Distributed infrastructure. While VCF brings aspects of cloud computing on premises, enterprise networks, applications, and users remain spread across numerous locations. Teams using traditional, fragmented tools often lack the deep, consistently generated metrics needed to correlate network health with application performance and end-user experience. Consequently, they struggle to understand the performance a user experiences when accessing services from a branch office, headquarters, home office, or even a coffee shop.
- Explosive growth in volume and complexity. Today's networks are more complex than ever before, and they only continue to grow more so. The sheer volume of virtual circuits and devices alone adds layers of intricacy. Virtual overlays are running on top of physical infrastructure. These dynamic environments, coupled with cloud-based gateway connectivity, further complicate the landscape.
Meeting the imperatives: The need for comprehensive network observability
To effectively address these challenges, teams need to establish comprehensive network observability. This means building upon the visibility offered by native monitoring tools like VMware Aria within VCF and establishing unified coverage that extends across VCF, on-premises environments, and diverse external environments—including middle mile, transit, and cloud provider networks.
Introducing Network Observability by Broadcom: Your unified view
Network Observability by Broadcom empowers network operations teams to conquer the complexities of modern networks. Featuring AppNeta by Broadcom, the platform provides the deep, unified visibility needed to proactively manage and optimize network performance. With AppNeta, you can pinpoint the root cause of issues, regardless of where they occur along the connectivity path.
Key capabilities
Active and passive monitoring
AppNeta continuously captures real-time data through active testing, monitoring network path changes over time for retroactive incident analysis. When thresholds are breached, it initiates additional diagnostic testing to pinpoint the cause and location of the issue.
Complete, cross-domain visibility
Network Observability by Broadcom provides unified, vendor-agnostic visibility that spans entire connectivity paths, without requiring cooperation from external providers. See complete network paths and their evolution. Track every hop across domains—from the VCF environment to the ISP network and ultimately to the cloud provider. Understand how VCF connections to hyperscaler environments are performing and drill down to see actual network paths between various user locations and the cloud. See which apps, such as Microsoft Teams or Outlook, are having the most issues in a given environment.
A central source of truth
With Network Observability by Broadcom, teams can gain unified visibility of data, including from VCF and other domains. The platform reduces alarm noise and streamlines triage. It provides different teams with unified visibility for faster, more effective collaboration. Whether your focus is network operations, VCF operations, or application performance, Broadcom delivers a single solution that provides the insights you need.
Address workload mobility challenges
VCF affords teams significant flexibility in moving workloads. As teams move workloads, it is vital to understand the evolving impact on network performance. AppNeta helps teams understand how network performance is affected by moving systems or components. Teams can track the "before and after" state, not just with basic health checks (up/down status), but also by detecting performance degradation. Utilize synthetic scripts against applications to assess breakdowns by network, server, or browser. Leverage intuitive waterfall charts and screenshots depicting errors.
Geographic visibility
Employ AppNeta to emulate user experiences from different locations. Plus, teams can deploy monitoring points in different locations to run tests from specific domains or technology environments.
Complete metrics
AppNeta provides comprehensive testing to see how the network reacts to both voice and data traffic, aligning with their specific characteristics, such as packet sizes. See detailed metrics like capacity, data loss, data jitter, round trip times, voice loss, voice jitter, and mean opinion score (MOS).
Benefits: Delivering measurable business value
AppNeta delivers significant, measurable business value, empowering teams to achieve these objectives:
- Optimize resource utilization and reduce costs. Gain objective measurements of external cloud providers or ISPs to hold them accountable for SLAs, negotiate better pricing, and proactively plan bandwidth based on actual usage and capacity. Teams can avoid unnecessary bandwidth investments by optimizing existing resources, enabling expanded coverage without extra investments or overhead. With the platform, customers can avoid 90% of bandwidth upgrade costs.
- Establish more proactive, efficient operations. Establish unified visibility across data centers, VCF environments, and cloud networks. Create a single source of intelligence for various teams, reducing finger-pointing and war room scenarios. Spot troublesome trends and address issues before they escalate into emergencies. In the process, you can reduce crisis management labor costs by 35% and system and network administration labor costs by 30%.
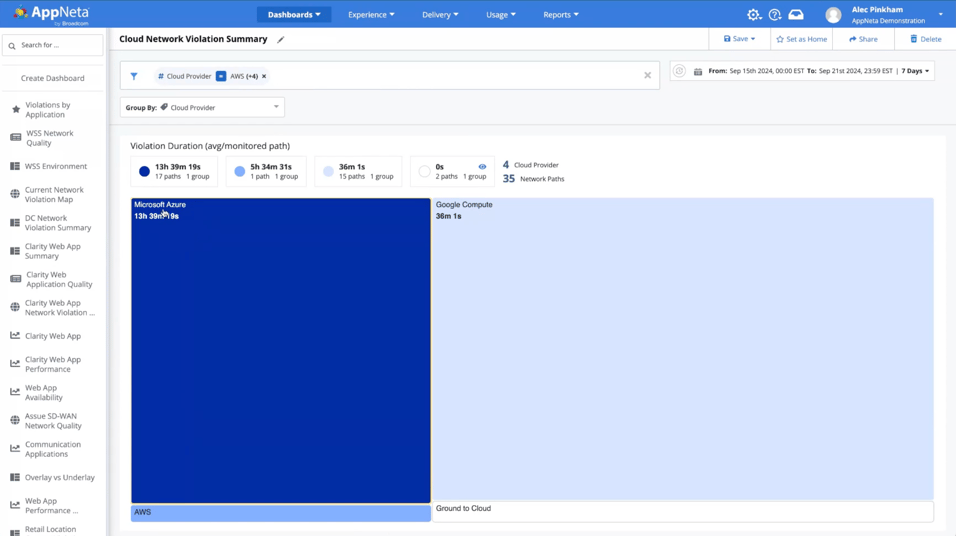
Sample dashboards and views
The Violation Summary dashboard provides a high-level view of network performance, highlighting which connections are experiencing the most issues and their violation duration. For example, you can quickly identify that connections to Microsoft Azure are violating their thresholds for the longest period within a given time window.
Conclusion: Gain control of your private cloud network
In the increasingly complex landscape of private and hybrid cloud environments, unified network observability is no longer optional—it's essential. With Network Observability by Broadcom, you can overcome the visibility gaps, fragmented tools, and distributed infrastructure challenges that hinder network operations. By establishing a single source of truth, you can proactively manage performance, optimize resource utilization, and deliver exceptional user experiences. With these capabilities, you can ensure your private cloud investment delivers maximum business value.
To learn more about VCF monitoring, be sure to view our recent Small Bytes webcast, Challenges of Monitoring Network Quality in VCF Environments.

Alec Pinkham
Alec is a Product Marketing Manager for the AppNeta solution at Broadcom. He spent seven years with AppNeta in the Application and Network Performance Monitoring space before joining Broadcom. Prior to AppNeta his background is in software product management in HMI/SCADA solutions for industrial automation as well as...
Other resources you might be interested in
What’s New in DX NetOps Topology: Summer 2026
See what’s new in DX NetOps topology. Leverage capabilities for expanded multi-vendor discovery, faster triage, custom views, and seamless data exports.
Rally Office Hours: July 23, 2026
Watch the Rally Office Hours from July 23, 2026, featuring updates on custom page migration, governance work rules tips, and upcoming widget releases.
Rally Office Hours: July 16, 2026
This July 16, 2026 Rally Office Hours session highlights a new custom pages substitution variable, custom page migration updates, and community Q&A.
Controlling Flow Telemetry Overhead in Distributed Environments
See how the latest updates to NetOps Flow reduce telemetry overhead and optimize WAN usage. Simplify data extraction and integration with the OData 4 API.
Clarity: Managing Reports
This course is designed for report consumers who need to access, analyze, and manage published reports in Clarity.
Automic Integration Brochure
This brochure serves as your guide to the diverse tools, platforms, and systems that can connect seamlessly with Automic.
Clarity: Configure Reporting Data Sources Using Data Providers
This course explains the data foundation that supports Reporting in Clarity. Learn how Data Providers prepare, organize, secure, and validate reporting data.
Rally Office Hours: July 9, 2026
This session covers the general availability of milestone delivery confidence, troubleshooting for custom views and admin functions, and upcoming webinars.
Network Observability NCM
See how Network Observability NCM delivers network configuration management capabilities that automate remediation, ensure compliance, and mitigate risk.