January 24, 2025

DX Operational Observability: Onboarding OpenTelemetry in Minutes

Written by: Srinivas Venkata Bevara
|
Key Takeaways
|
|
In our era of cloud-native applications, robust observability is critical to maintain performance, identify issues, and enhance user experiences. With its advanced capabilities, DX Operational Observability (DX O2) integrates seamlessly with OpenTelemetry, a leading open-source observability framework. In this blog, we explore how to onboard the OpenTelemetry Demo Application to DX O2. The demo application provides a hands-on introduction to combining these powerful tools.
OpenTelemetry with DX Operational Observability
OpenTelemetry has emerged as an industry standard for collecting observability signals such as metrics, traces, and logs, complementing proprietary telemetry collection methods like those offered by DX O2. With compatibilities across diverse environments and technologies, OpenTelemetry is a helpful addition to modern observability stacks. By integrating OpenTelemetry with proprietary telemetry, organizations benefit from enhanced correlation—from applications to infrastructure, hosts, and containers. This creates a more comprehensive and actionable observability experience and yields richer insights for users. The combination of DX O2, a next-gen AIOps and observability solution from Broadcom, and OpenTelemetry, which is supported by the open-source community, helps organizations meet the ever-changing demands of modern observability, including for cloud-native environments.
With this integration, organizations can leverage standardized telemetry data of OpenTelemetry and advanced analytics capabilities of DX O2 for a unified observability solution. Here's how this synergy delivers unmatched value:
- Seamless integration: With built-in support for OpenTelemetry’s OTLP format, DX O2 supports effortless telemetry ingestion, which simplifies data collection from diverse sources.
- Enhanced insights: By combining OpenTelemetry’s standardized telemetry signals, metrics, and traces with advanced analytics provided by DX O2, users gain deeper visibility into application performance and system health.
- Future-ready architecture: DX O2 aligns with emerging observability standards to maintain compatibility with modern tools and technologies, and to future-proof observability as organizational needs change over time.
Supported Telemetry Signals
- Metrics: Aggregated time-series data representing system performance, resource utilization, and application health, enabling trend analysis and anomaly detection.
- Traces: Distributed transaction data that captures the lifecycle of requests across services, providing deep visibility into application workflows and dependencies.
OpenTelemetry Components
- SDKs: OTel SDKs are available for multiple programming languages, such as Java, Python, and Go. These SDKs provide APIs for instrumenting applications to generate traces and metrics.
- Instrumentation libraries (agents): OpenTelemetry offers libraries for popular frameworks to enable automatic instrumentation, eliminating the need for manual code changes.
- Exporters: Exporters facilitate sending telemetry data to various backends; in this case, DX O2.
Experience OpenTelemetry in action with DX O2
OpenTelemetry Demo Application
Many organizations are eager to experiment with OpenTelemetry, but face challenges due to the lack of a robust reference implementation. To address this gap, the OpenTelemetry community developed the OTel Demo Application—a practical tool to demonstrate its capabilities in real-world scenarios.
This resource serves as a starting point for new users to explore capabilities of DX O2. The demo application helps users learn how OpenTelemetry seamlessly integrates with and enhances the AIOps and observability capabilities available with DX O2. The guide simplifies the onboarding process and highlights the powerful synergy between OpenTelemetry and DX O2.

OpenTelemetry Demo Site: Mock Online Store
The OpenTelemetry Demo Application showcases how telemetry data can be collected from applications using multiple approaches, including instrumentation-based agents, SDKs, and receivers. These components seamlessly transmit the collected data through the OpenTelemetry Collector, which serves as a central hub for telemetry processing and exporting. The demo simplifies the process of deploying a test-ready, interconnected, and multi-language service environment. It is a valuable tool for exploring OpenTelemetry and accelerating its adoption and integration with DX O2.
This blog describes telemetry ingestion using the OTel Demo Application from OpenTelemetry and highlights select capabilities of DX O2.
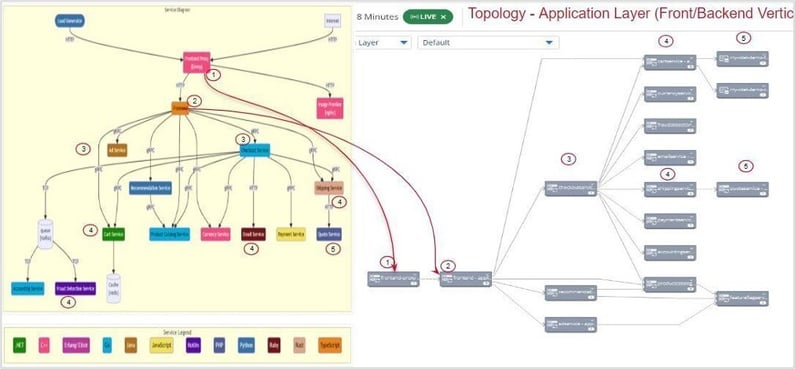
(Left side - OTel Demo Application and Right side DX O2 Topology)
Onboard OpenTelemetry Demo Application
This section provides an overview of onboarding the OpenTelemetry Demo Application on a Kubernetes cluster.
For detailed deployment steps, refer to the official OpenTelemetry Demo Guide available from the OTel community.
For detailed instructions, visit: OpenTelemetry Demo Kubernetes Deployment
|
Note: Before deploying the OpenTelemetry Demo application, please follow the steps below to configure the OpenTelemetry Collector exporter for integration with the DX O2 backend. |
Configure OpenTelemetry Collector for DX O2
The OTel Collector is highly configurable, allowing you to specify receivers for collecting telemetry data, apply processors to enhance or modify the data, and configure exporters to send the processed data to the DX O2 observability stack, tailoring it to your specific requirements.
Update the OpenTelemetry Demo’s otelcol exporter component to export metrics and traces to DX O2, either using the OTLP HTTP exporter (otlphttp) to transmit data over the HTTP protocol or the OTLP exporter (otlp) using the gRPC protocol.
- Update config: Add DX O2 OTel Endpoint and authorization token to the OTel Demo Collector’s exporter configuration.
exporters:otlphttp/dx:endpoint: <DX O2 OTel Endpoint>headers:Authorization: "Bearer <DX O2 Agent Token>"connectors:spanmetrics:dimensions:- name: db.system- name: http.method- name: http.request.method- name: messaging.system- name: rpc.system- name: peer.serviceaggregation_temporality: AGGREGATION_TEMPORALITY_DELTA
For reference, here is the full OTel Collector configuration.
|
Tips:
|
Follow these instructions using OTel Demo Helm charts on Kubernetes.
DX O2 and OpenTelemetry: Better together
DX Operational Observability enhances the OpenTelemetry Demo by streamlining the onboarding process with automated telemetry signal generation.
Integration between OpenTelemetry and DX O2 improves, and in some cases enables, the following:
- Real-time metrics: Monitor key performance indicators in an intuitive interface.
- Transaction traces: Gain insights into distributed transaction trace flows across services.
- Services: Obtain insights into service health, risks, alarms, and service-level objective (SLO) metrics.
- Topology: Visualize service dependencies and interactions.
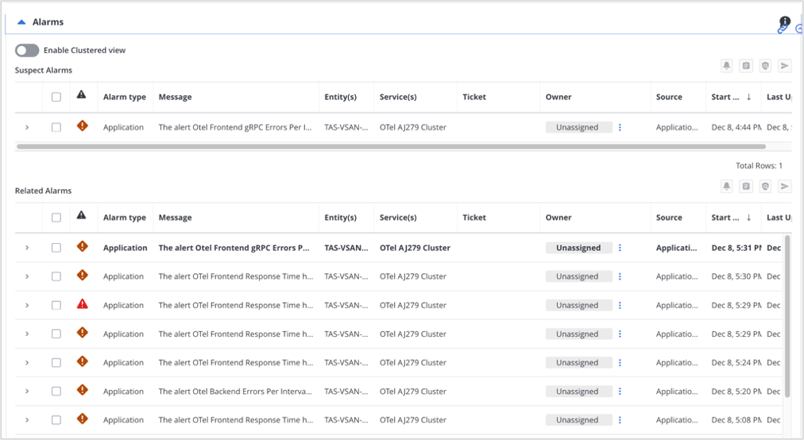
- Alarms: Identify anomalous behavior from metric sources, highlighting caution and danger signals.
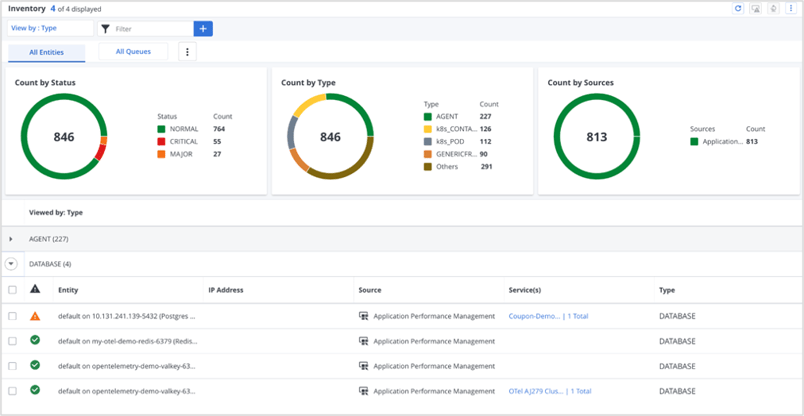
- Monitored inventory: View a unified inventory of all entities reporting to DX O2, enabling faster triage, optimized monitoring, and comprehensive insights into device health and cross-domain impacts.
Service overview dashboard
DX O2 provides a centralized view of service health to help teams identify and proactively address potential issues. This dashboard presents key insights, such as risk analysis to help users understand service performance by highlighting failures and providing context that shows associated alarms and anomalies. The dashboard also tracks service-level indicators (SLIs) and evaluates compliance with SLOs. This helps to ensure operational standards are met.
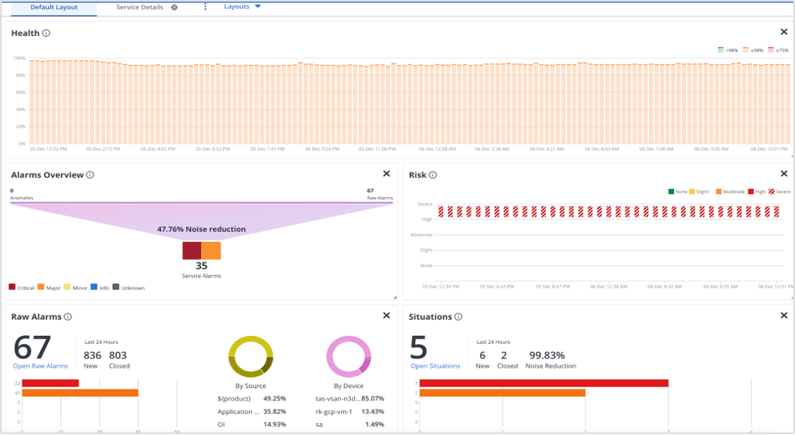
For more details, refer to these resources:
Triaging Inspector
The Triaging Inspector is a powerful capability designed to simplify and accelerate root cause analysis. Accessible directly from the Service Overview Dashboard in DX O2, it empowers users to identify and resolve issues more quickly by consolidating critical insights into a single, intuitive interface. Structured into four key sections, (Topology, Transaction Traces, Alarms, and Metrics) it offers a comprehensive view of service health and performance.
Triaging Inspector provides a unified interface to analyze affected services so users can seamlessly triage issues from a single location. By consolidating the necessary data and context, it eliminates the need to navigate multiple tools or dashboards. It also offers a concise summary that highlights the potential root cause of the issue, presents actionable insights, and guides users to clear starting points for additional investigation if necessary.
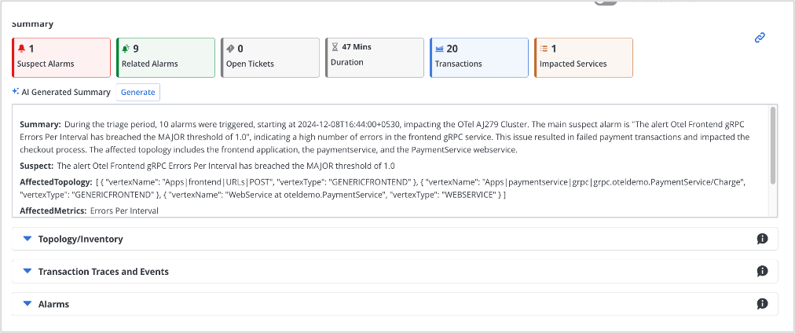

Topology View
The Topology View in DX O2 presents a graphical representation of correlated services and their sub-services as a complete detailed topology hierarchy from the OpenTelemetry Demo e-commerce application. This includes associated parent and child elements along with key details.
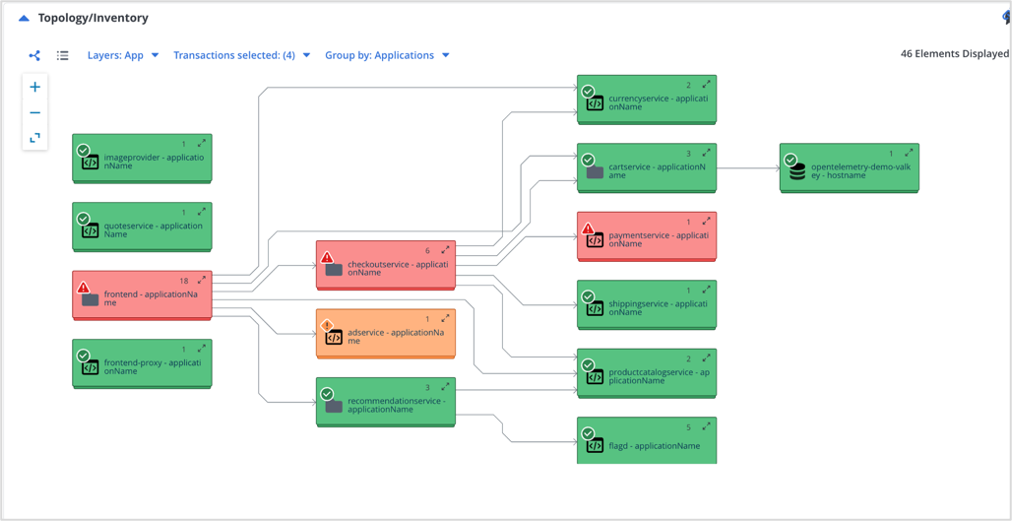
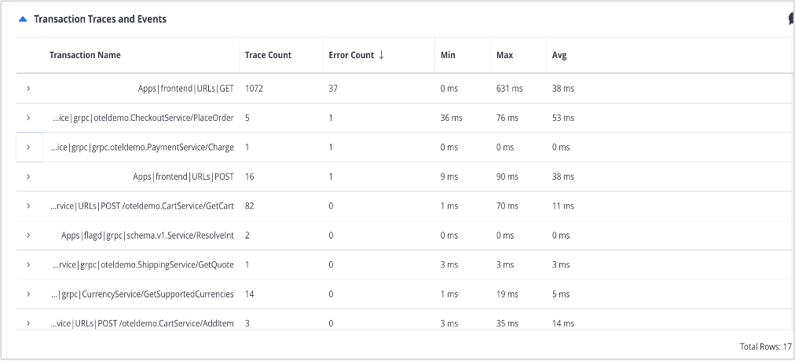
Directly from the Topology View, users can select a transaction trace to view the full trace details for a specific transaction. This will open all correlated distributed transaction traces across services.
Below is the reference of how spans are correlated across interconnected OTel Demo Application services in the DX O2 Topology from the OTel Demo Application.
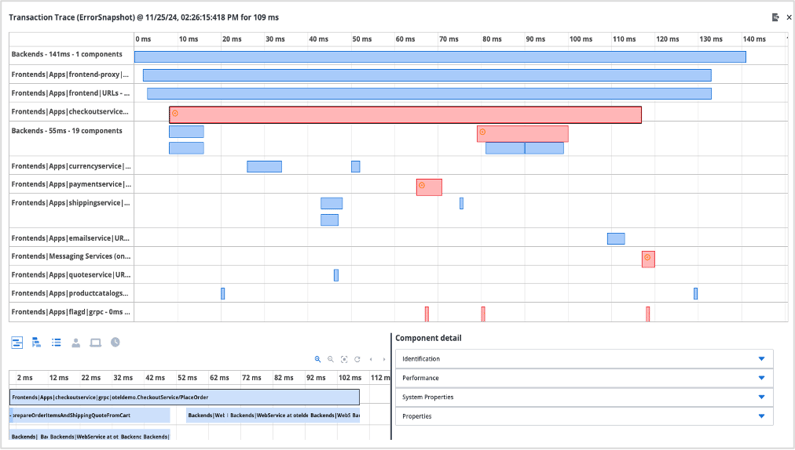
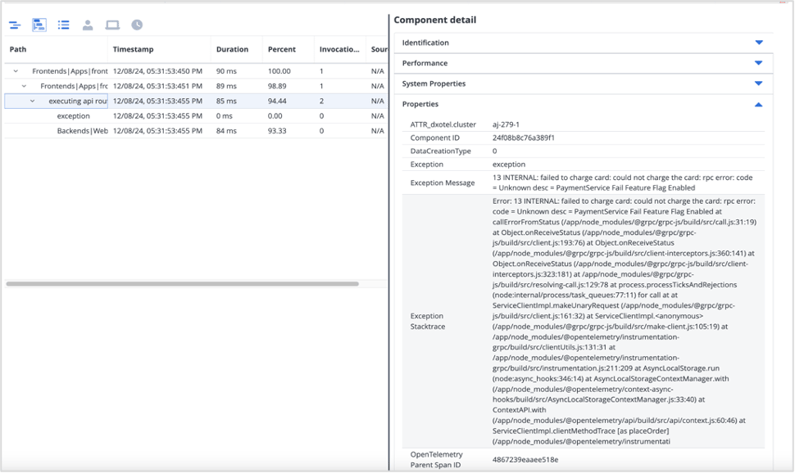
Users can also select a suspicious trace to drill down further and view the problem from component details.
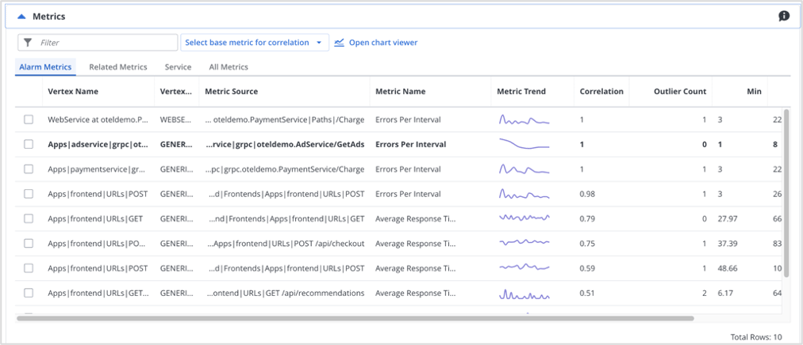
View metric attributes
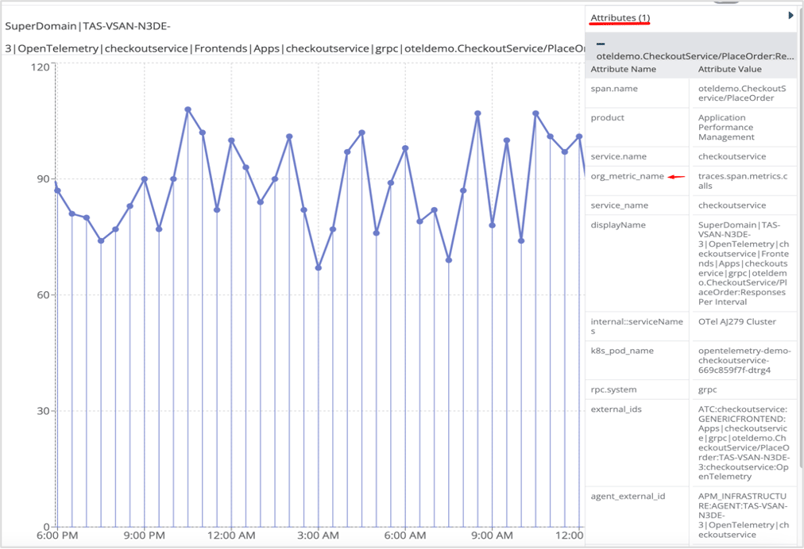
OTLP metric data point attributes are persisted into DX O2 metrics. These attributes enhance the context and granularity of metrics and allow for more effective filtering, segmentation, and analysis. Additionally, attributes enable the correlation of metrics with traces, inventory, and alerts to provide deeper insights across various observability signals. It will help create dashboards with more customization options.
This integration of these attributes ensures that metrics are not only collected but also enriched to provide comprehensive visibility into application behavior and system performance. Teams also benefit from these attributes when creating and using custom dashboards within DX O2.
Example: Filtering metrics using attributes like HTTP status code 429 can help track errors associated with specific requests.
|
Note: Many OTel metrics are transformed into hierarchical metric paths and names. However, users can still find the original metric name in the attribute "org_metric_name" which can be used for filtering or dashboards, even though the metric name has changed. |
Here are metadata attributes showing all OTLP metric data points.
Recap of Benefits
OpenTelemetry data can be ingested into DX O2 within minutes by following a few simple steps.
With OpenTelemetry and DX O2 integration, organizations gain a powerful solution for full-stack observability. Customers benefit from an open, flexible, and powerful observability stack tailored to meet the demands of modern, cloud-native environments. This empowers organizations to improve performance, troubleshoot faster, and optimize resources effectively.
The integration of OpenTelemetry with DX O2 helps organizations address observability gaps, which improves correlation analysis and reduces triage and remediation time for users. By bringing OpenTelemetry data into DX O2, organizations can:
- Unify observability: Work from a single pane of glass for correlating metrics and traces.
- Enhance troubleshooting: Leverage anomaly detection and root cause analysis of DX O2 to resolve issues faster.
- Improve operational efficiency: Streamline observability workflows with automation and advanced visualization.

Srinivas Venkata Bevara
Srinivas Venkata Bevara is a Software Architect at Broadcom specializing in designing and optimizing observability solutions using modern technologies such as OpenTelemetry, eBPF, and Prometheus. With 19 years of experience in building scalable, fault-tolerant distributed systems, he excels in cloud-native...
Other resources you might be interested in
Your Root Cause Analysis is Flawed by Design
Discover the critical flaw in your troubleshooting approaches. Employ network observability to extend your visibility across the entire service delivery path.
Whose Fault Is It When the Cloud Fails? Does It Matter?
In today's interconnected environments, it is vital to gain visibility into networks you don't own, including internet and cloud provider infrastructures.
Rally Office Hours: October 9, 2025
Discover Rally's new AI-powered Team Health Widget for flow metrics and drill-downs on feature charts. Plus, get updates on WIP limits and future enhancements.
AAI - Navigating the Interface and Refining Data Views
This course introduces you to AAI’s interface and shows you how to navigate efficiently, work with tables, and refine large datasets using search and filter tools.
Rally Office Hours: October 16, 2025
Rally's new AI-driven feature automates artifact breakdown - transforming features into stories or stories into tasks - saving time and ensuring consistency.
What’s New in Network Observability for Fall 2025
Discover how the Fall 2025 release of Network Observability by Broadcom introduces powerful new capabilities, elevating your insights and automation.
Modernizing Monitoring in a Converged IT-OT Landscape
The energy sector is shifting, driven by rapid grid modernization and the convergence of IT and OT networks. Traditional monitoring tools fall short.
Your network isn't infrastructure anymore. It's a product.
See why it’s time to stop managing infrastructure and start treating the network as your company's most critical product. Justify investments and prove ROI.
The Network Engineers You Can't Hire? They Already Work for You
See how the proliferation of siloed monitoring tools exacerbates IT skills gaps. Implement an observability platform that empowers the teams you already have.