|
Key Takeaways
|
|
DX Operational Observability (DX O2), a next-generation AIOps and Observability solution from Broadcom, offers two powerful capabilities that generate valuable insights from complex log data. Since DX O2 supports ingestion of logs from a wide variety of sources, the solution offers an enormous opportunity to improve observability and power AIOps.
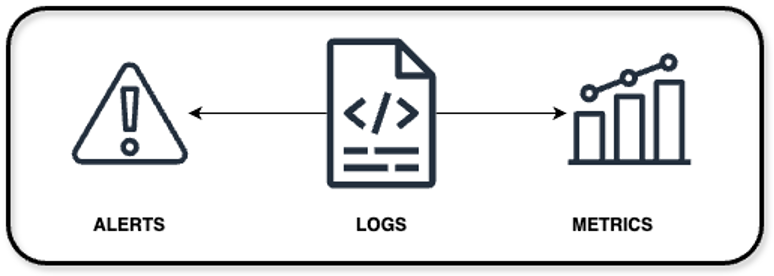
Same data—different uses: Log-based alerts and log-based metrics
DX O2 uses the same log data to support log-based alerts and log-based metrics. The insights DX O2 generates, the use cases, and, to some extent, the primary beneficiaries of these two capabilities are fundamentally different. Understanding these differences can help teams shorten the path to value when adopting these capabilities and it can help them take full advantage of each capability.
|
Log-based alerts |
Log-based metrics |
|
These are alarms that are triggered when specific patterns, keywords, or conditions are detected in log entries. They monitor raw log data for pre-defined events, such as error messages, security incidents, and performance issues. When these conditions occur, teams receive real-time alerts. Log-based alerts are useful for immediate issue detection and response. |
Derived from log data, such as error rates, request counts, or response times, these are metrics that show time-series data to illustrate trends and highlight anomalies. Log-based metrics transform raw log entries into structured, quantifiable insights that enable trend analysis, real-time monitoring, and threshold-based alerting. This enables better observability and decision-making. |
In this blog, I take a deeper look into how log-based metrics can provide a more actionable approach to observability and how to generate these metrics.
Advantages of log-based metrics
- Aggregated insights: Provide aggregated and summarized time-series data, such as:
- Error rates: The number of error log entries over time.
- Request counts: The number of API or HTTP requests logged within a specific time frame.
- User activity metrics: User behavior activities, such as login attempts and page views from application logs.
- Fewer alarms: Enable threshold-based alarms that consider trends (e.g., “error rate exceeds 5% for 10 minutes”) rather than alerting for every single occurrence of an error. This reduces the number of unnecessary alerts.
- Real-time monitoring and visualization: Can be visualized in dashboards to show real-time graphs, trends, and distributions. This makes it easier to monitor the system's health at-a-glance.
- Actionable insights: By summarizing data, metrics make it easier to define key performance indicators (KPIs) and analyze performance over time.
Generating log-based metrics
To define log-based metrics in DX O2, you must configure these three parameters:
- Metric condition: A condition which, when met, will generate metrics. This condition can be stated in the form of Lucene syntax, for example “syslog_severity: warning”.
- Frequency: This determines the granularity of generated metric data. This value can be as small as 1 minute and as large as 120 minutes.
- Log type or index name: This property determines the index on which the query will run. In DX O2, out-of-the-box indexes are segregated by log types.
In addition to the parameters above, a Group By field is also available, which, when selected, generates multiple time-series data. This additional criterion works on the Keyword field only. This is shown in the example below.
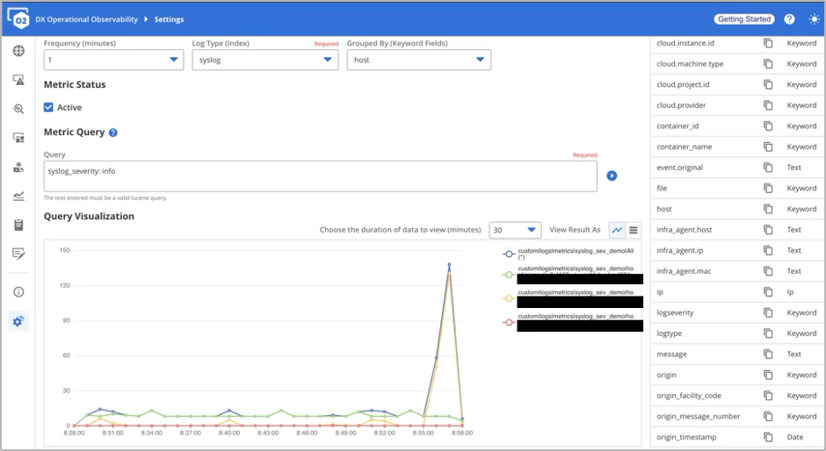
Multiple time series are created, one for each host, as HOST is the Group By field.
These metrics can also be accessed easily from the Metric Browser as illustrated below:
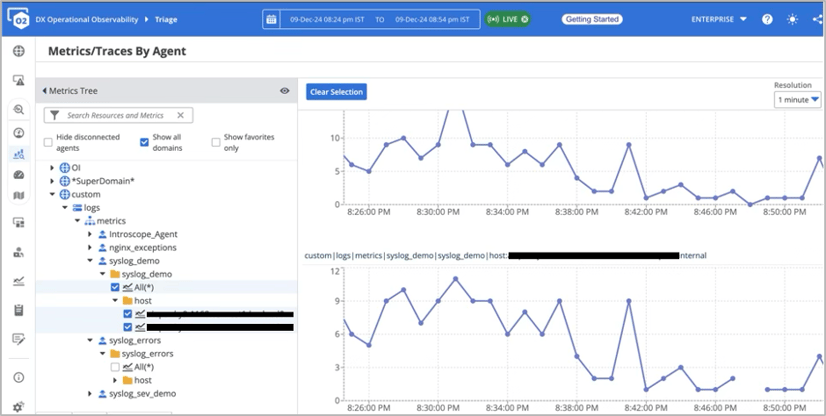
These metrics can now be used in DX Dashboards for visualization purposes as well as for analyzing trends over time. They can also be used for threshold-based alerting. Moreover, since these metrics can be grouped by a host, container, and more, they retain helpful context. Context enrichment is a significant benefit for practitioners working with complex log data, and for organizations where IT operations data is shared across teams during triage, remediation, performance analysis, or other work.
Log-based alarms help the team get started and add logs to the monitoring mix. Log-based metrics help make systems truly observable, enable additional analysis, and generate powerful insights, while keeping costs in check. Get started! Try these log-based metric capabilities in your environment.
Additional resources

Pramit Saxena
Pramit Saxena is a Product Manager for DX Operational Intelligence and focuses on Integration, ITSM, and Data Security for the product. He has extensive experience in building and managing enterprise products across Telco, Cloud, Infrastructure, and Operations verticals.
Other resources you might be interested in
This Halloween, the Scariest Monsters Are in Your Network
See how network observability can help you identify and tame the zombies, vampires, and werewolves lurking in your network infrastructure.
Your Root Cause Analysis is Flawed by Design
Discover the critical flaw in your troubleshooting approaches. Employ network observability to extend your visibility across the entire service delivery path.
Whose Fault Is It When the Cloud Fails? Does It Matter?
In today's interconnected environments, it is vital to gain visibility into networks you don't own, including internet and cloud provider infrastructures.
The Future of Network Configuration Management is Unified, Not Uncertain
Read this post and discover how Broadcom is breathing new life into the trusted Voyence NCM, making it a core part of its unified observability platform.
Rally Office Hours: October 9, 2025
Discover Rally's new AI-powered Team Health Widget for flow metrics and drill-downs on feature charts. Plus, get updates on WIP limits and future enhancements.
AAI - Navigating the Interface and Refining Data Views
This course introduces you to AAI’s interface and shows you how to navigate efficiently, work with tables, and refine large datasets using search and filter tools.
Rally Office Hours: October 16, 2025
Rally's new AI-driven feature automates artifact breakdown - transforming features into stories or stories into tasks - saving time and ensuring consistency.
What’s New in Network Observability for Fall 2025
Discover how the Fall 2025 release of Network Observability by Broadcom introduces powerful new capabilities, elevating your insights and automation.
Modernizing Monitoring in a Converged IT-OT Landscape
The energy sector is shifting, driven by rapid grid modernization and the convergence of IT and OT networks. Traditional monitoring tools fall short.