Recently, our colleague Nate Bever wrote about the importance of building trust and managing expectations and how teams can achieve this through proper Capacity Planning.
In this post, we dive into more of the details around how you can set capacity for a team. First off, let’s be clear that capacity for a team simply means the likely number of work items or story points that the team can deliver in a given timebox. Note that when we talk about capacity planning, we are talking about a mid-range timebox, such as a quarter, release, or program increment (approximately three months). We are not attempting to create detailed, waterfall-style plans that span multiple quarters.
No matter how your team delivers work, thinking through how much work those teams should be expected to complete in a set span of weeks is a valuable exercise. A key factor in developing trust in your teams’ commitments is that you have a reasonable basis for making those commitments. This should not be an exercise in sticking your finger in the air to discern which way the wind is blowing, not when a wealth of historical data can be at your fingertips instead.
If your role includes planning work for one or more teams then you most likely already have a system for predicting how much work will be completed. Here’s a key question to ask: Are these predictions based on solid facts, or are they based more on intuition and guesswork?
Today, there are a number of sources you can use in Rally to gather historical delivery data. Plus, the Rally team has also been delivering more of this information where you can use it: right on the Team Board page. For example, we can look at the flow metrics charts on the Team Board page and check the team’s velocity or throughput during prior time periods.
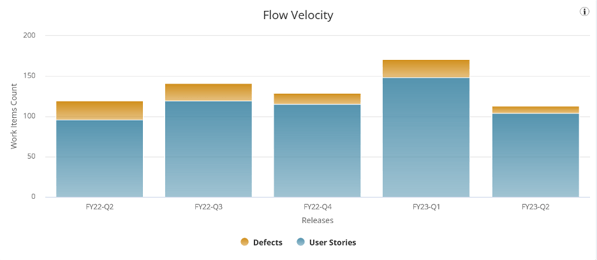
To forecast team capacity, one simple approach is to take an average of story points (or work item counts) delivered over several past time periods and use that value to set capacity in the next time period. For example, if you see that your team’s average throughput during the last five quarters was 135 work items and the team composition is not changing in the next quarter, then you would use 135 work items as a baseline for your team’s capacity in the next quarter. You could then adjust that value up or down based on your team’s context – accounting for holidays and vacations, and the like. The following Flow Velocity chart is visible on the Flow Metrics tab within Team Board charts. Select the Flow Velocity by Items Count button.
If the team instead uses story points, select the Flow Velocity by Plan Estimate button to view their story point data. This team might take their average velocity of 346 story points per quarter as their capacity.
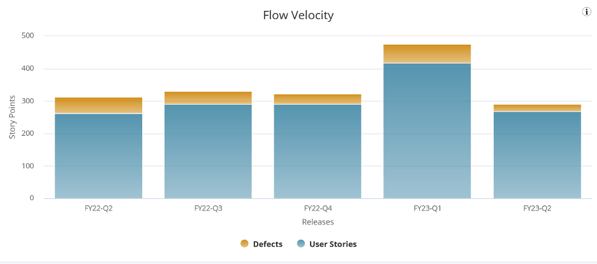
The eagle-eyed reader will notice that one quarter is not like the others, however. If you are using averages, how confident can you truly be that this team will not deliver closer to 300 story points which they did in four out of the five previous quarters? Or perhaps they have another 475 story point quarter up their sleeves?* This goes right back to the question posed earlier: How much guesswork should we tolerate in planning?
Taking an average across timeboxes for a team with variable output means that sometimes a team will deliver more than expected, but will sometimes deliver less than the average indicated. Delivering less than that average may mean the team missed a commitment. So, unless your team tends to have very stable output quarter over quarter, it appears that simply using average values is still no better than sticking your finger in the air.
Using averages thoughtfully is better than not trying to plan at all, but there is a better way. How can you use historical data to both better understand the range of possibilities in a team’s work completion rate, and quantify the risks in achieving a certain level of output? Stay tuned for the next installment of this series, in which we’ll begin to discuss probabilistic forecasting tools that will soon be available in Rally.
Future articles will dive into more of the technical details of how our forecasting tools work, and others will discuss more practical issues. For example, for teams whose output is highly variable, we’ll look at steps they can take to become more predictable. If you’d like to learn more about using data in Rally, please check out our webinar, “Learn to Prioritize Product Strategy Related to Execution for Your Value Streams.”
*In the absence of better alternatives, our suggestion in this story point example would be to exclude FY23-Q1, which would yield a four-quarter average of 314 points, and use that since those four quarters are relatively stable.

Asya Gershkovich and William Karlin
Asya Gershkovich is a Product Owner in ValueOps, working with multiple teams to build valuable products and enhance AI capabilities. She fosters a culture of trust, transparency, and collaboration, enabling teams to thrive in high-uncertainty environments. Passionate about innovation, she is dedicated to leveraging AI...
Other resources you might be interested in
What’s New in DX NetOps Topology: Summer 2026
See what’s new in DX NetOps topology. Leverage capabilities for expanded multi-vendor discovery, faster triage, custom views, and seamless data exports.
Rally Office Hours: July 23, 2026
Watch the Rally Office Hours from July 23, 2026, featuring updates on custom page migration, governance work rules tips, and upcoming widget releases.
Rally Office Hours: July 16, 2026
This July 16, 2026 Rally Office Hours session highlights a new custom pages substitution variable, custom page migration updates, and community Q&A.
Controlling Flow Telemetry Overhead in Distributed Environments
See how the latest updates to NetOps Flow reduce telemetry overhead and optimize WAN usage. Simplify data extraction and integration with the OData 4 API.
Clarity: Managing Reports
This course is designed for report consumers who need to access, analyze, and manage published reports in Clarity.
Automic Integration Brochure
This brochure serves as your guide to the diverse tools, platforms, and systems that can connect seamlessly with Automic.
Clarity: Configure Reporting Data Sources Using Data Providers
This course explains the data foundation that supports Reporting in Clarity. Learn how Data Providers prepare, organize, secure, and validate reporting data.
Rally Office Hours: July 9, 2026
This session covers the general availability of milestone delivery confidence, troubleshooting for custom views and admin functions, and upcoming webinars.
Network Observability NCM
See how Network Observability NCM delivers network configuration management capabilities that automate remediation, ensure compliance, and mitigate risk.