January 12, 2023
Automic Automation Intelligence: Gain Insights to Boost Workload Throughput
Written by: Jennifer Chisik
To boost SLA compliance in automation environments, it’s vital to spot and preempt the bottlenecks that can degrade workload throughput. By providing a unified view across multi-vendor and multi-platform automation environments, Automic Automation Intelligence provides the rich insights that can fuel continued optimization of workload throughput. Read on to discover all the ways your team can leverage the solution.
Automic Automation Intelligence: Solution Introduction
With Automic Automation Intelligence, teams can establish a cohesive platform for doing cross-platform, cross-vendor SLA management in automation environments. The solution provides a real-time, unified view of intelligence from a range of platforms, including Automic Automation, AutoSys, CA-7, ESP, Control-M z/d, IWS z/d, and Tidal Enterprise Scheduler. In addition, the solution offers capabilities for incorporating automation data from external applications and any other automation engine.
With the solution, teams can leverage enhanced workload analytics. The solution offers these advanced features:
- Dynamic critical path discovery. The solution can do real-time discovery of the critical paths required to meet SLAs.
- Business context. With the solution, you can establish monitoring visibility that’s aligned with your business. You can tailor views to specific business units and workflows, so you have critical business context for managing workloads.
- Predictive alerting. The solution can provide predictive alerting so teams can intelligently predict and preempt potential issues that could jeopardize SLAs.
- Advanced change control. The solution also offers intelligence for managing changes. For example, it enables you to simulate potential modifcations and gauge their impact on SLAs, before rolling those changes out to production.
In the following sections, I’ll describe some of the specific reports and capabilities you can leverage to maximize throughput in your environments.
Jobstream Summary Report: Identify Problematic Jobstreams
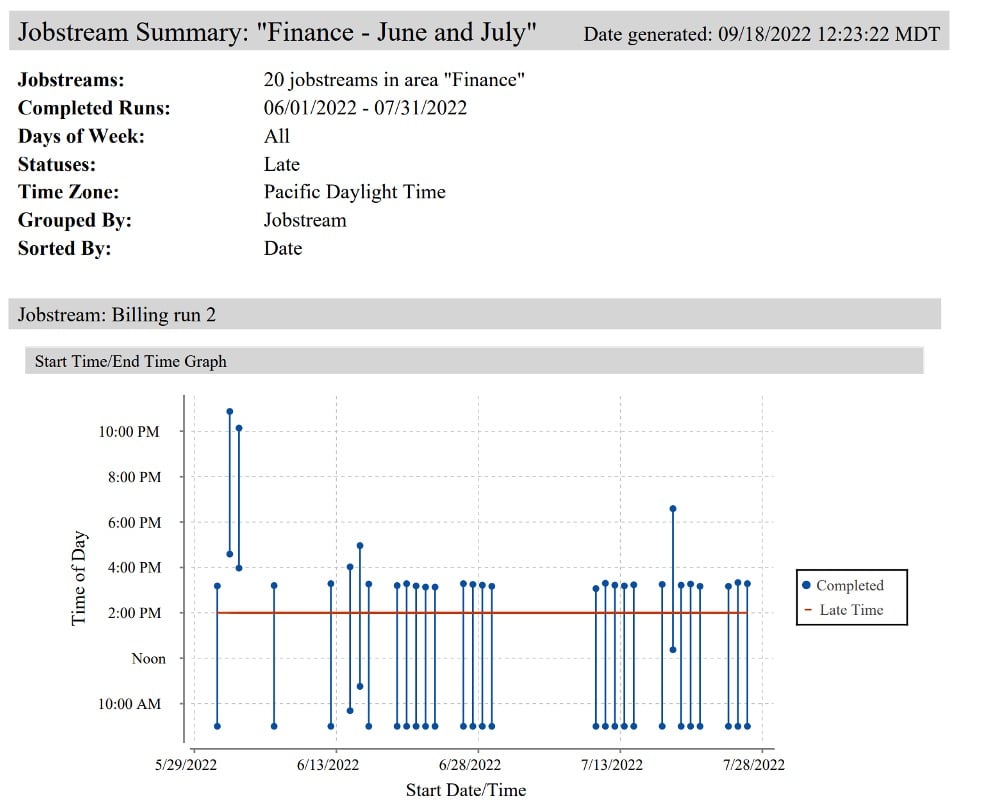
In many of our larger enterprise accounts, teams may be running tens of thousands or even millions of automation jobs. With Automic Automation Intelligence, teams can gain a unified view of all these jobs, and most efficiently identify those jobstreams that may be suboptimal or problematic.
Automic Automation Intelligence combines rich historical data in a central database, which enables your teams to gain critical insights into workload trends. For example, a user may discover that a particular jobstream is running late on Fridays, which can help reveal potential issues and solutions.
The jobstream summary report can display performance of jobstreams, and flag those that are running late or missing SLAs. These views can easily be filtered to enhance analysis efficiency. For example, you can filter by business area and isolate views by specified time periods.

Trending by Critical Path History Report: Determine Why a Jobstream is Late
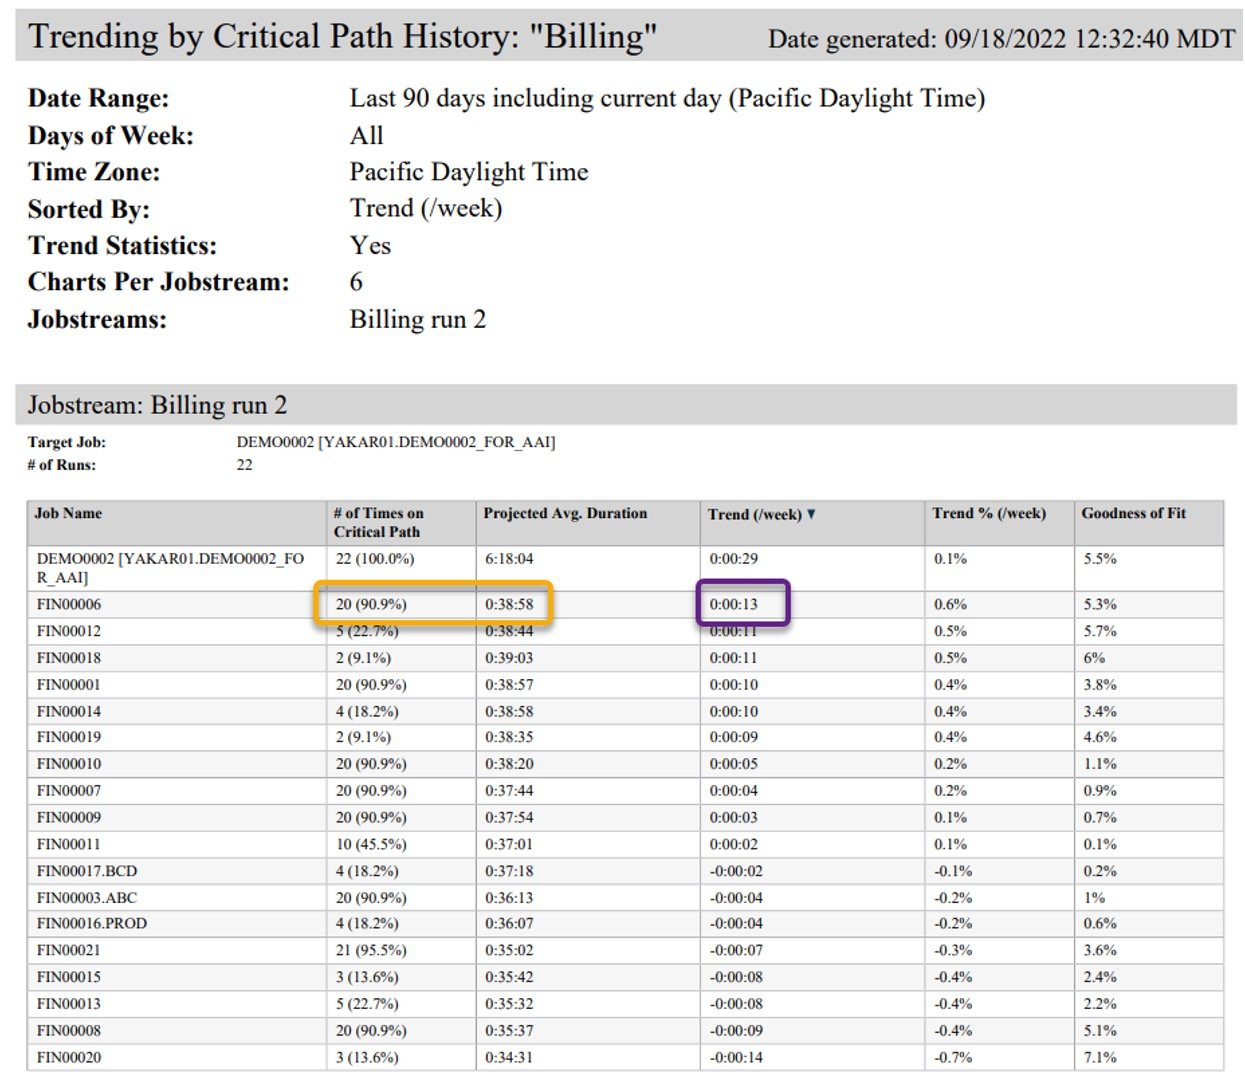
Once an administrator has identified problematic jobstreams, they’ll next want to uncover why there’s an issue. At this point, they can run a “trending by critical path history report.” This report will display jobs within the job stream, and reveal those that are historically in the jobstream’s critical path. Users can easily find jobs that are taking progressively more time to complete. They can also spot the anomalies that periodically affect critical paths. In this way, teams can find the best areas to focus their optimization efforts.

Jobstream Detail Report: Analyze the Critical Path of a Problematic Run
An administrator may next want to do further investigation on a particularly problematic run. They can do so by running a jobstream detail report. This will help them determine why the run was late.
The report displays all jobs in the critical path and how long they ran, and it reveals the ongoing average time for the job to complete. By comparing current completion times against averages, administrators can quickly identify those jobs that may be the cause of diminished throughput. This report can be customized and filtered based on a range of critical criteria, such as times. For example, an administrator can look at reports for each Friday over the course of a month, and identify jobs that are taking longer than average to run on those days.
Gantt Charts: Visualize Problematic Runs
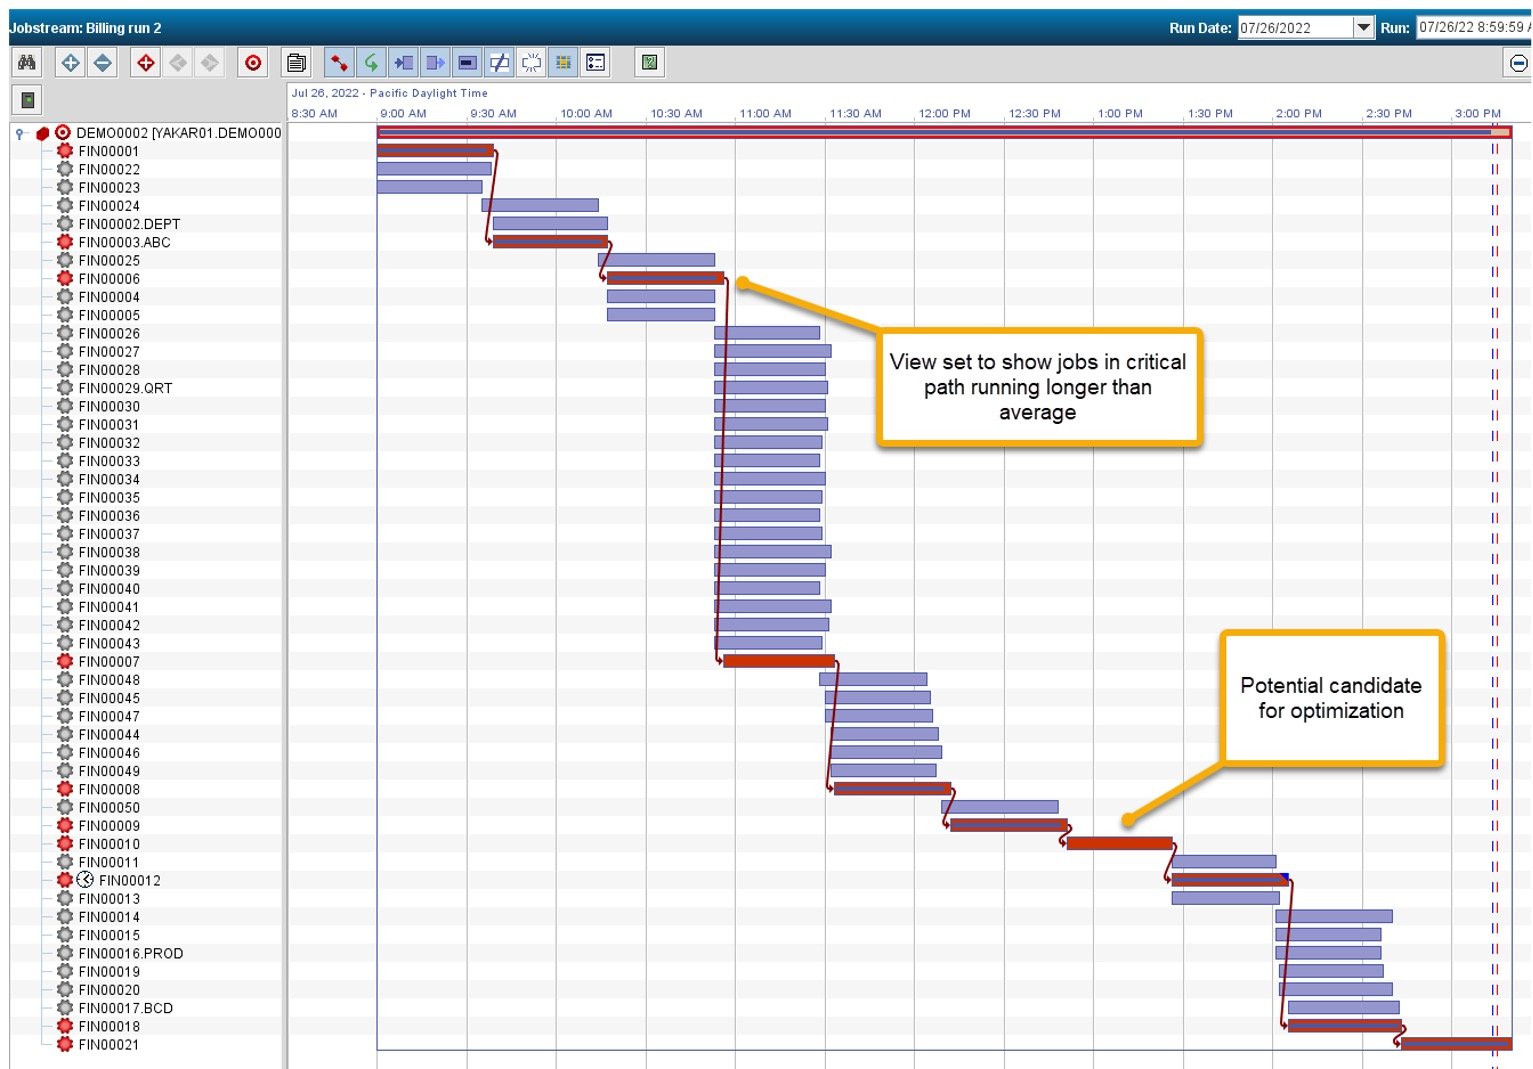
With Automic Automation Intelligence, teams can generate Gantt charts, which offer a visual display of averages and actual completion times. These charts display critical-path jobs in red and average completion times in blue. These charts also highlight jobs that ran longer than average. The charts also display missed SLAs. By analyzing these charts, administrators can quickly determine which job was contributing to a delay. Once bottlenecks have been uncovered, teams can identify where to focus optimization efforts.

Jobstream Summary Report: Understand Delays
Delays can occur because of latency within the automation engine itself (a system delay) or because of something outside of the automation engine’s control (a non-system delay) such as a failed job halting progress. All of these issues can have a significant impact on overall throughput and whether SLAs are met.
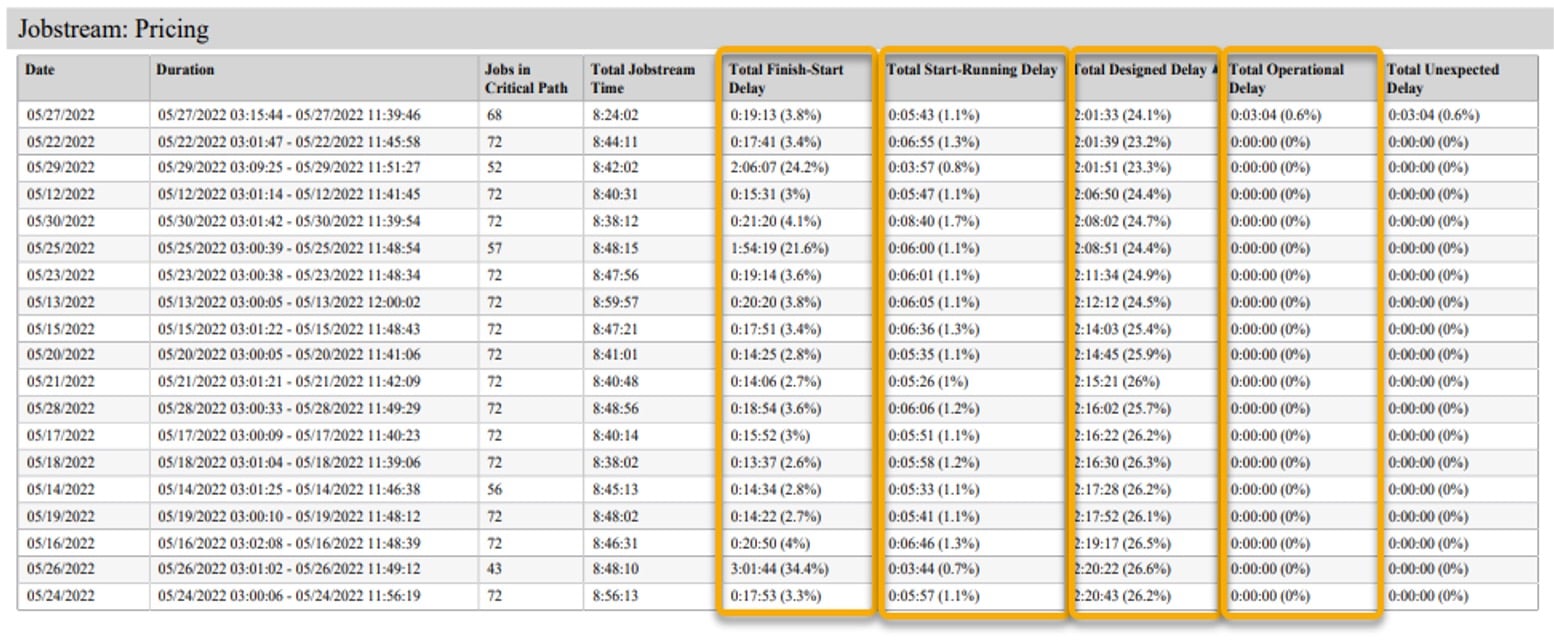
The jobstream summary report offers an overview of all the delays that occur across a critical path, across all jobs. This summary report looks at individual runs, revealing what percentage of time is associated with each type of delay. Automic Automation Intelligence tracks these different categories of delays:
- Finish to start. This is a system-level delay, which is defined as the time between when all the conditions necessary to start a job have been met and when the job actually starts. These delays can be due to a number of reasons. For example, many jobs scheduled to start at the same time can cause a systemic delay. Automic Automation Intelligence will identify these delays for every job. While these delays are typically brief, they can spike during busy times. For example, if a number of jobs end up being scheduled to start at midnight, competing resource demands can lead to significant finish-to-start delays.
- Start to running. This is another system-level delay. This refers to the delay between when a job is requested to start and when it actually starts. These delays can typically be addressed through infrastructure optimization. If an organization is running a distributed job scheduler, the control system may instruct an agent to start a job. It may take a few seconds between when the instruction is issued and when the job actually starts. While these delays may often be short, they’re important to track. If a delay extends longer, for example 15-20 seconds, it may indicate there’s a performance issue with the agent that needs to be addressed.
- Designed delay. This is a non-system-level delay. These are delays that can be attributed to configurations or designs. For example, this could be a job in the middle of a stream that has a hard start time, which can lead to a delay that keeps subsequent jobs from running. This type of configuration could be a legacy artifact or there could be a legitimate business reason for the setting. With Automic Automation Intelligence, teams can pinpoint these delays, understand the impact, and determine whether there’s an opportunity to make improvements.
- Operational delay. This is another non-system-level delay, which represents the gap between when a job fails and it is restarted by an operator. This may be associated with a recurring or one-off issue, and can have a range of causes. These delays can have a significant impact on throughput and ultimately lead to missed SLAs. Particularly if a manual restart is required after a failure that happens repeatedly, there may be a number of ways to make enhancements.

Trending by Job Run History Report: Spot Trends in Job Levels
In large enterprise environments, a million or more jobs may run every day. Given the scale of all these jobs, finding issues can start to feel like trying to find the proverbial needle in a haystack. With the “trending by job run history report,” teams can find the needles they’re looking for. This report automatically reveals those jobs that take progressively longer over time.
There are a number of ways to customize these reports. Teams can filter based on specific job names or prefixes to look at the specific jobs they’re interested in. They can also customize time intervals, such as tracking over 30- or 90-day periods to gain visibility into trends.
Conclusion
Automic Automation Intelligence provides a historical database that delivers a wealth of insights, including across platforms and vendors. There are a number of reports that enable teams to capitalize on this intelligence and boost reliability, throughput, and SLA compliance. In addition to all the reports summarized above, Broadcom will continue to deliver ongoing enhancements to the solution, including expanding the new web-based user interface and analytics capabilities.
For more information and resources, visit the Automic Automation Intelligence pages on the Broadcom Software Academy.
Jennifer Chisik
Jennifer Chisik is currently the Head of Product for Automation Analytics & Intelligence (AAI) at Broadcom, Inc. AAI is an analytics platform providing organizations with cross-vendor, cross-platform visibility into their complex automation environments. She came to Broadcom via their acquisition of Terma Software,...