|
Key Takeaways
|
|
Currently, I’m a scrum master for the Rally team, and, over my career, I’ve worked as a scrum master in several large organizations. Over these years, I’ve witnessed how teams depend on iteration metrics, specifically iteration burnup charts, to get a pulse on how global scrum teams are doing. Iteration burnup charts enable teams to gain these insights:
- Determine if teams are on track to meet their commitments.
- Visualize the planned and final scope of the iteration.
- Monitor scope changes.
- Spot patterns in how teams accept stories and deliver customer value.
- Assess how well the team planned for the iteration.
However, I’m here to tell you that flow metrics should be another key factor in understanding the health of your team’s performance. Let me explain my rationale.
The main goal of all teams is to deliver customer value. Let’s think about the delivery of customer value as a stream or a flow. Does that flow stop at the end of the iteration and start again at the beginning of the next one? The answer is no. The boundaries of the iteration go beyond the iteration performance data that burnup charts deliver. Flow metrics provide insight as to how effective, efficient, and predictable the team is at delivering customer value.
Flow Metrics are new to Rally. Flow Metrics can be found on the Team Board page. These metrics help scrum masters like myself to understand key trends. They show how teams are doing over a period of time and whether they are improving over that time.
Flow Metrics are designed to provide a view into the efficiency and predictability of the team and their deliverables. These metrics can help teams reduce waste and attain unimpeded flow, so they can increase the value delivered and improve predictability.
Flow Metrics charts include:
- Flow Velocity / Throughput
- Flow Load
- Flow Time
- Flow Efficiency
- Flow Predictability
Flow Metrics help to answer the following questions:
- Are we delivering more or less?
- Are we delivering faster?
- Are we predictable?
- Is there waste in our development process?
The sections below reveal some of the Flow Metrics charts you can monitor.
Flow velocity
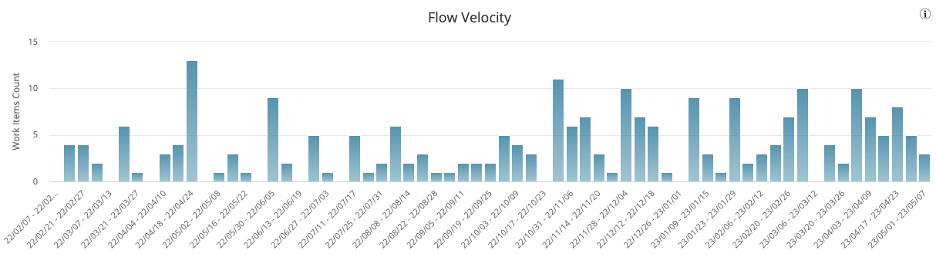
The Flow Velocity chart provides historical data for tracking the number of user stories and defects (throughput) or the number of points (velocity) that were completed over a given period of time. In Rally, you can select different timeboxes and monitor the number of working items/points by iterations, months, quarters, weeks, or releases.
What I like to see on this chart is a consistent amount of work items/points that the team completes for each time box. This is how I know the team is becoming predictable. If you see that a team has a high degree of variability in their throughput/velocity (as on the screenshot below), you probably need to have a conversation with the team.
These are a few questions I like to ask to understand why there is variability:
- Are there any blockers that prevent the work items from being completed quickly?
- Does the product owner accept the work items quickly?
- What is the team’s workflow and are there any states in which work items are stuck. For example, do the stories sit in peer review for a long time?
- If the team has a different ratio of defects to stories each time box, why does it happen?
- Is your team estimating the work items consistently?
- Does your team collaborate and swarm on the work items in order to complete the iteration plan?
Flow distribution
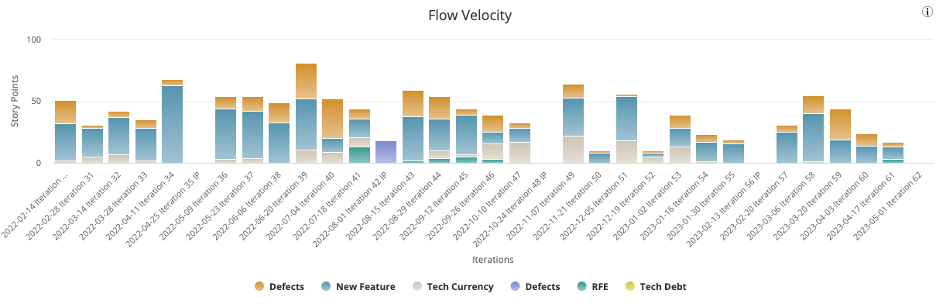
Flow Distribution allows teams to see the work distribution based on the parent portfolio item’s investment category. This can provide a clear way to see the area in which the team is spending most of their time. For example, perhaps the team was expected to be doing 80% new feature work but is only doing 50%. Is it bogged down in defect work?
Flow time
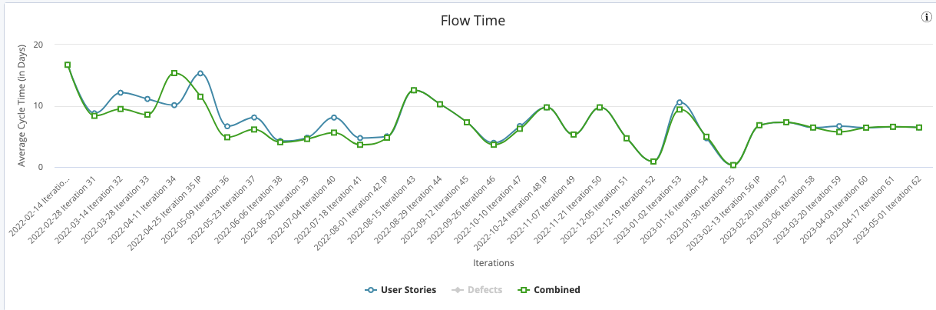
Flow Time ensures that organizations and teams focus on what is important—delivering value to the business and customer as fast as possible. In the lead/cycle time chart, you can set up the time box and monitor the cycle/lead time by iterations, months, quarters, weeks, or releases. I like to see low lead/cycle times for the stories and defects the team is working on. If the cycle time increases, I probably need to have a conversation with the team.
These are some topics that I cover to understand why teams experience increases in cycle time:
- Do they break down the work items into small chunks, so the work can be completed faster and more consistently?
- If your team is a Scrum team planning for iterations, the stories should fit the iteration. For example, if your iteration is two weeks and an average cycle time for the stories is more than 10 days, the team needs to break down the stories into smaller chunks of work. For stories, it is good to target cycle times below five days. This means that the team slices the work into really small chunks and delivers the customer value quickly.
- Do they follow their work-in-progress (WIP) limits? They might have too much WIP, causing delivery to slow.
- Are there any blockers or bottlenecks that prevent the flow of work items?
- Are there any distractions that are preventing the team from completing their work quickly?
Below is a pretty healthy Flow Time chart for the team (this team is using two-week iterations and is not working on defects):
Flow load
Flow Load tells me if WIP is overloading teams. Flow load indicates how many items are currently in the system. Keeping a healthy, limited number of active items (limiting WIP) is critical to enabling a fast flow of items through the system.
If your team tends to have high WIP, my advice is to discuss this topic in your retrospectives. These are the questions I use for discussion:
- Does the team have WIP limits set up on the Team Board?
- Do they follow their WIP limits and focus on the work items or do they have to switch between different work? If the latter, what is the reason?
- If the number of work items in testing exceeds the WIP limit, do the developers swarm on testing before they pull in new dev work?
Flow efficiency
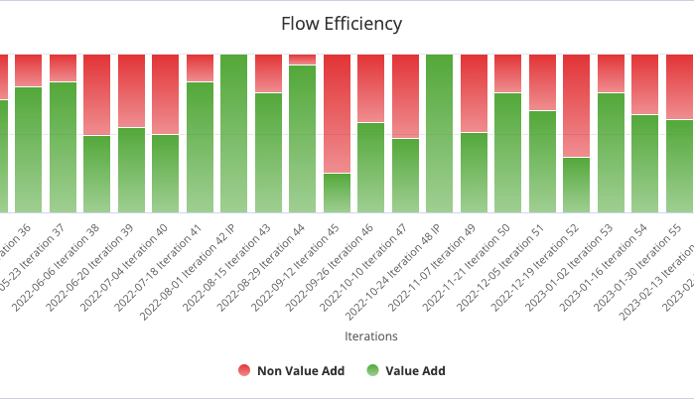
This chart provides insight into your team's delivery in terms of Value Add (green) and Non Value Add (red). The higher the Value Add percentage, the more efficient your team's process is.
Non Value Add (NVA) is calculated based on the time that work items spend in a Blocked or Ready state in a given timebox. If your Flow Efficiency is low, it’s an indication of waste—items stagnating in a wait state for some reason.
So if your team has a high NVA percentage as on the screenshot below, it is probably a good idea to have a conversation with the team:
- Do they have blocked work items and, if so, what is the reason for the blockage? Can the scrum master help to remove these impediments?
- Does the number of blocked work items increase or decrease?
- The team probably has work items stuck in Ready state. Does the product owner accept the stories quickly?
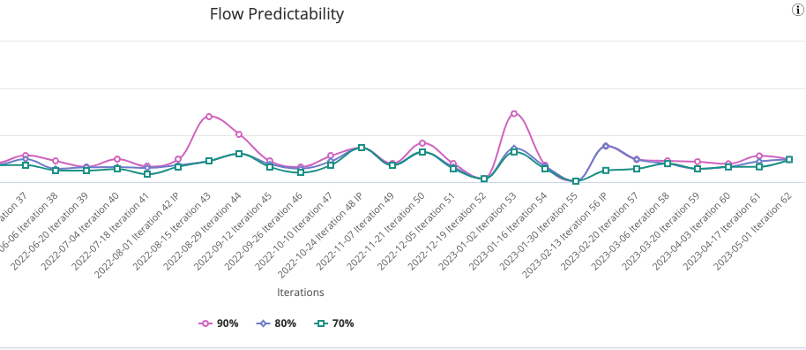
Flow predictability
The Flow Predictability chart provides insights into your team’s cycle times and predictability. Ideally, the percentile lines should stay close to each other, while going down slightly over time. This means that your workflow is predictable and that your teams deliver value at a fast and consistent pace. The chart reveals these metrics:
- 90th, 80th, and 70th Percentile: How many days it took to deliver 90%, 80%, and 70% of the work items within a given timebox.
The Flow Predictability chart can be a quick diagnostic tool: If you have a team working in two-week iterations, do they complete 70% of their stories within two weeks, or is it 80% or 90%? For a high performing and predictable Scrum team that uses two-week iterations, you would expect most of the work items (90th percentile) to be accepted in 14 days or less.
On the screenshot below you can see that the team improved their predictability during several last iterations.
Conclusion
My Advice: By regularly tracking and analyzing these metrics, Scrum teams can identify areas for improvement and continuously optimize their workflow. As a result, they can deliver high-quality products in a timely manner, ultimately improving their overall performance and productivity. Now that sounds like an amazing team!
To learn more, I encourage you to explore our Agile Analytics For Digital Transformation educational webinar series. This series is intended to help you improve planning, tracking, and forecasting. These webinars demystify common agile metrics and provide practical knowledge so teams are empowered to identify actions for continuous improvement. For even deeper learning, we also have an Agile Analytics for Digital Transformation eBook available.

Asya Gershkovich
Asya Gershkovich is a Product Owner in ValueOps, working with multiple teams to build valuable products and enhance AI capabilities. She fosters a culture of trust, transparency, and collaboration, enabling teams to thrive in high-uncertainty environments. Passionate about innovation, she is dedicated to leveraging AI...
Other resources you might be interested in
What’s New in DX NetOps Topology: Summer 2026
See what’s new in DX NetOps topology. Leverage capabilities for expanded multi-vendor discovery, faster triage, custom views, and seamless data exports.
Rally Office Hours: July 23, 2026
Watch the Rally Office Hours from July 23, 2026, featuring updates on custom page migration, governance work rules tips, and upcoming widget releases.
Rally Office Hours: July 16, 2026
This July 16, 2026 Rally Office Hours session highlights a new custom pages substitution variable, custom page migration updates, and community Q&A.
Controlling Flow Telemetry Overhead in Distributed Environments
See how the latest updates to NetOps Flow reduce telemetry overhead and optimize WAN usage. Simplify data extraction and integration with the OData 4 API.
Clarity: Managing Reports
This course is designed for report consumers who need to access, analyze, and manage published reports in Clarity.
Automic Integration Brochure
This brochure serves as your guide to the diverse tools, platforms, and systems that can connect seamlessly with Automic.
Clarity: Configure Reporting Data Sources Using Data Providers
This course explains the data foundation that supports Reporting in Clarity. Learn how Data Providers prepare, organize, secure, and validate reporting data.
Rally Office Hours: July 9, 2026
This session covers the general availability of milestone delivery confidence, troubleshooting for custom views and admin functions, and upcoming webinars.
Network Observability NCM
See how Network Observability NCM delivers network configuration management capabilities that automate remediation, ensure compliance, and mitigate risk.