| Note: This post was co-authored by Sean Whitney |
|
Key Takeaways
|
|
AppNeta comes pre-loaded with a number of powerful dashboards and reports so you can quickly and easily understand your network performance.
But what if your team uses Grafana to visualize its network operation monitoring data?
Simple—just set up a connection between AppNeta’s API and Grafana. You’ll be able to visualize all your networking data in one place.
This article is a step-by-step guide to set up a connection between AppNeta and Grafana using AppNeta’s API. Here are the topics covered:
- Prerequisites
- Step 1: Create an API access token in AppNeta
- Step 2: Install the Infinity plugin on Grafana
- Step 3: Configure the data source in Grafana
- Step 4: Create a dashboard to visualize AppNeta data
Prerequisites
To set up this integration, you’ll need to start with the following:
- An active AppNeta account. You’ll need an AppNeta account with users, organizations, and licenses. Ideally, you’ll also have monitoring set up and generating data. If you’re not there yet, check out the Getting Started section of the AppNeta docs.
- An active Grafana account. You’ll also need to be able to log into Grafana, add plugins, and create new dashboards. See Grafana’s website for details on setting up a Grafana account.
Step 1: Create an API access token in AppNeta
The AppNeta API makes data collected and generated by AppNeta available for analysis, reporting, and presentation in third-party systems. Data is delivered in a lightweight JSON format that can be readily consumed by a broad range of third-party applications—including Grafana.
To use the API with Grafana, start by creating an API access token using the steps below.
|
Tip: Prefer to access these steps in a video? Watch our step-by-step tutorial for a visual guide. |
- In AppNeta, navigate to
> Manage Access Tokens, and click Create Token.
- Enter a token name. This can be a descriptive name that includes spaces.
- Specify an expiration date (or check Never). The token is revoked automatically at expiration.
- Select a Role for the token. This determines what data can be brought into Grafana.
- Important: When creating API tokens, we recommend following these security best practices: create it for a single purpose, and create it with the minimum access and duration needed for the purpose of the token. For retrieving data, we recommend using a View Only token. See API Access Tokens for more on API access token security considerations.
- In the Organization Membership section, check Use dynamic membership if you want the token to access any organizations the user has access to now and in the future (as new organizations are added or removed).
- In the Select Organizations section, check the organizations you want the token to have access to.
- Note: The selection of organizations is static. New organizations available to the user will not be accessible by the token.
- Click Create Token and then copy the token and save it.
- Important: It will not appear again.
- Click Finished.
With the token you have produced, you can give Grafana the authorization it needs to pull monitoring data from AppNeta.
Step 2: Install the Infinity plugin on Grafana
Next, you need to download the Infinity plugin on Grafana—we’re going to pull AppNeta monitoring data into it.
There are two ways to install the plugin—either with the user interface or with the command line interface.
User interface method
To install the Infinity Plugin from the Grafana user interface:
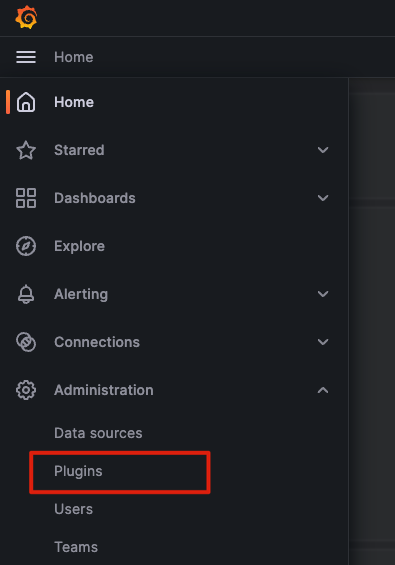
1. Log into Grafana and navigate to Administration > Plugins.
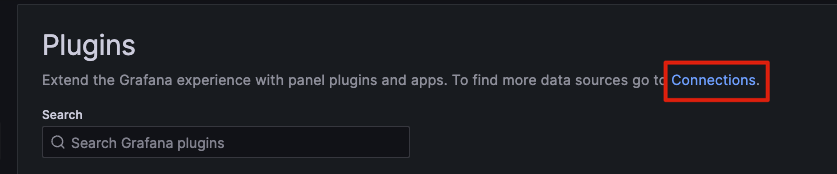
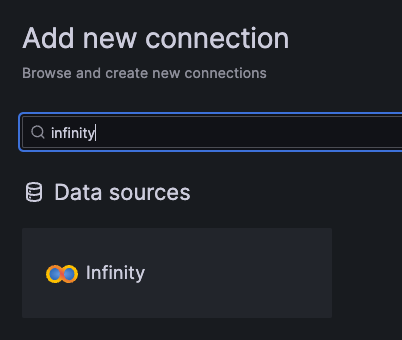
2. Click Connections and search for the Infinity plugin.
3. Select Infinity and click Install.
Command line method
To install the Infinity plugin through the command line, use the following commands:
grafana-cli plugins install yesoreyeram-infinity-datasourcesystemctl restart grafana-server
Step 3: Configure the data source in Grafana
The next step is to configure the data source, connecting the AppNeta API to the Infinity plugin within Grafana:
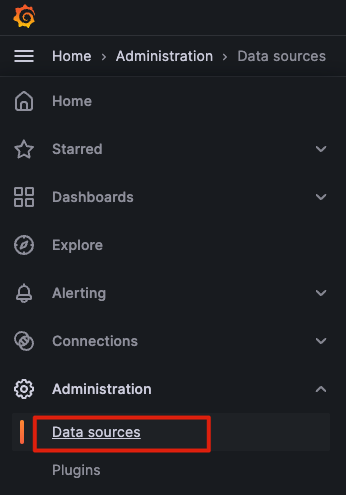
1. In Grafana, navigate to Administration > Data sources from the dropdown menu.
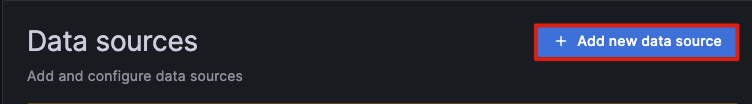
2. Click Add new data source.
3. In the search bar, enter Infinity and select the Infinity plugin.

4. In the Name field, enter a meaningful name for the data source. Then, navigate to Authentication and select Setup Authentication.
Tip: We recommend naming the data source with either the URL for the specific AppNeta application node or a friendly name such as AppNeta. Your AppNeta node is the first part of the URL you access when logged into AppNeta. (For example, if the URL you use to access AppNeta is app-21.pm.appneta.com, the node is app-21.) See AppNeta Service Details for instructions to find your application node. |

5. Select API Key Value Pair, then enter Authorization in the Key field and Token <API token> in the Value field, where <API token> is an AppNeta API access token string that you generated earlier. Token values are case sensitive.

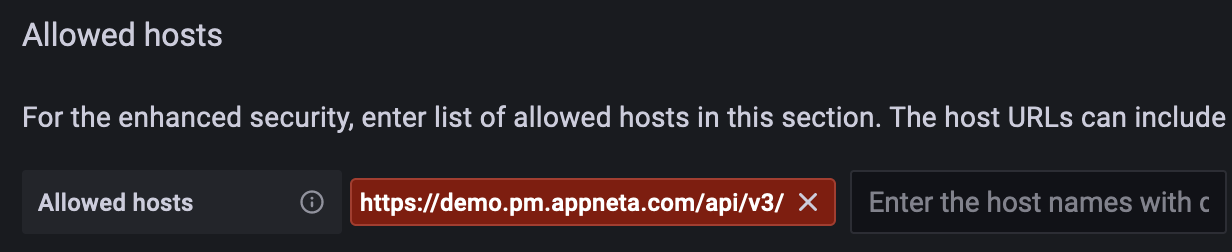
6. In the Allowed hosts field, enter the AppNeta API URL in the format https://<application-node>.appneta.com/api/v3/, where <application-node> is the application node for your AppNeta instance. Again, see AppNeta Service Details for instructions to find your application node.
|
Note: Your entry in the Allowed hosts field may appear purple, as in the image above, or red, as seen below: |
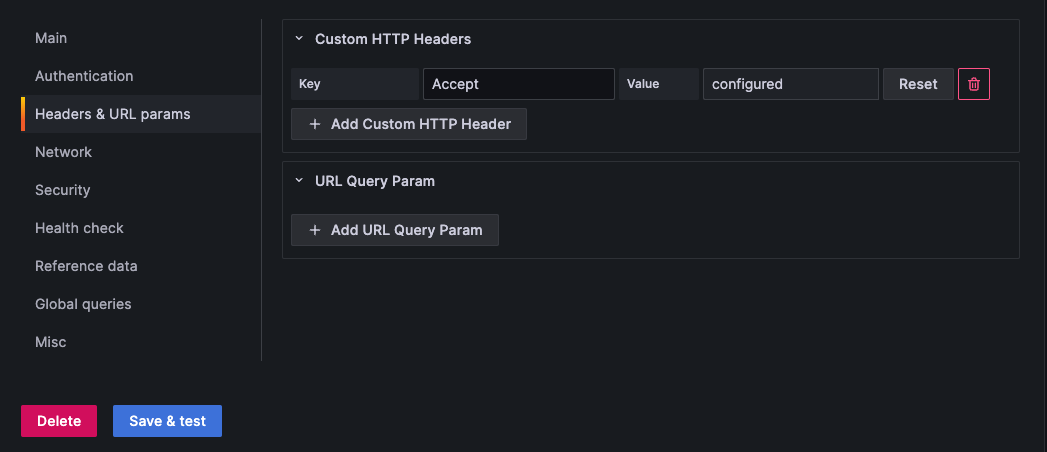
7. Navigate to Headers & URL params and create a new custom HTTP header, entering Accept in the Key field and application/json in the Value field.
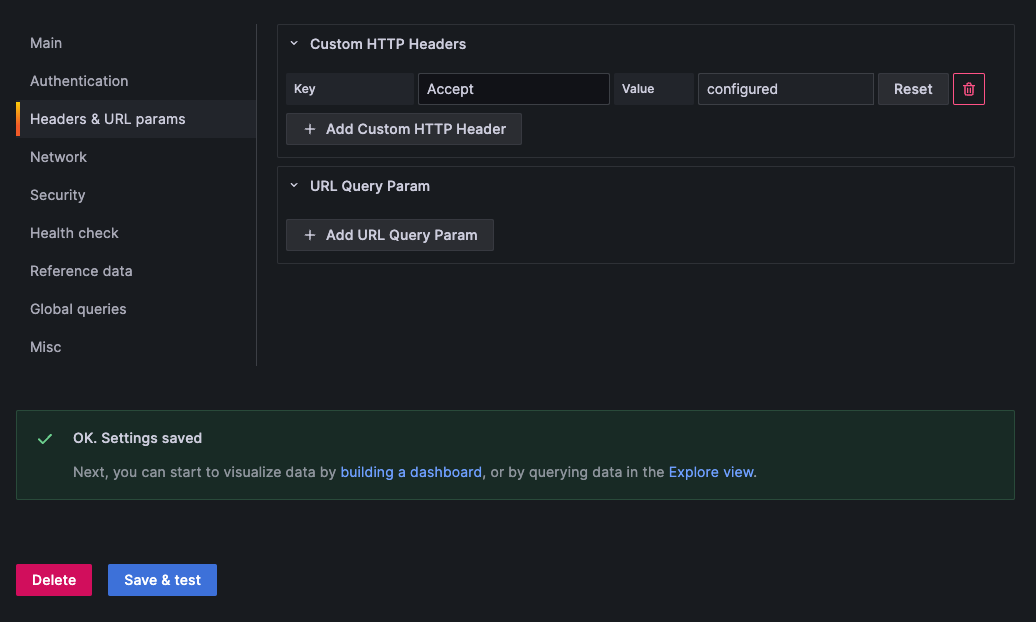
8. Click Save & test. If there are no errors, you will see this message: OK. Settings saved.
|
Tip: In this section, we set the AppNeta API as a data source. You can also configure Grafana to access your database directly by specifying the database target and providing authentication credentials. For more information, see Grafana documentation on connecting data sources. |
Step 4: Create a dashboard to visualize AppNeta data
You’ve set up the Infinity Plugin in Grafana to pull data from AppNeta. Next, we’ll set up a dashboard in Grafana to visualize that data:
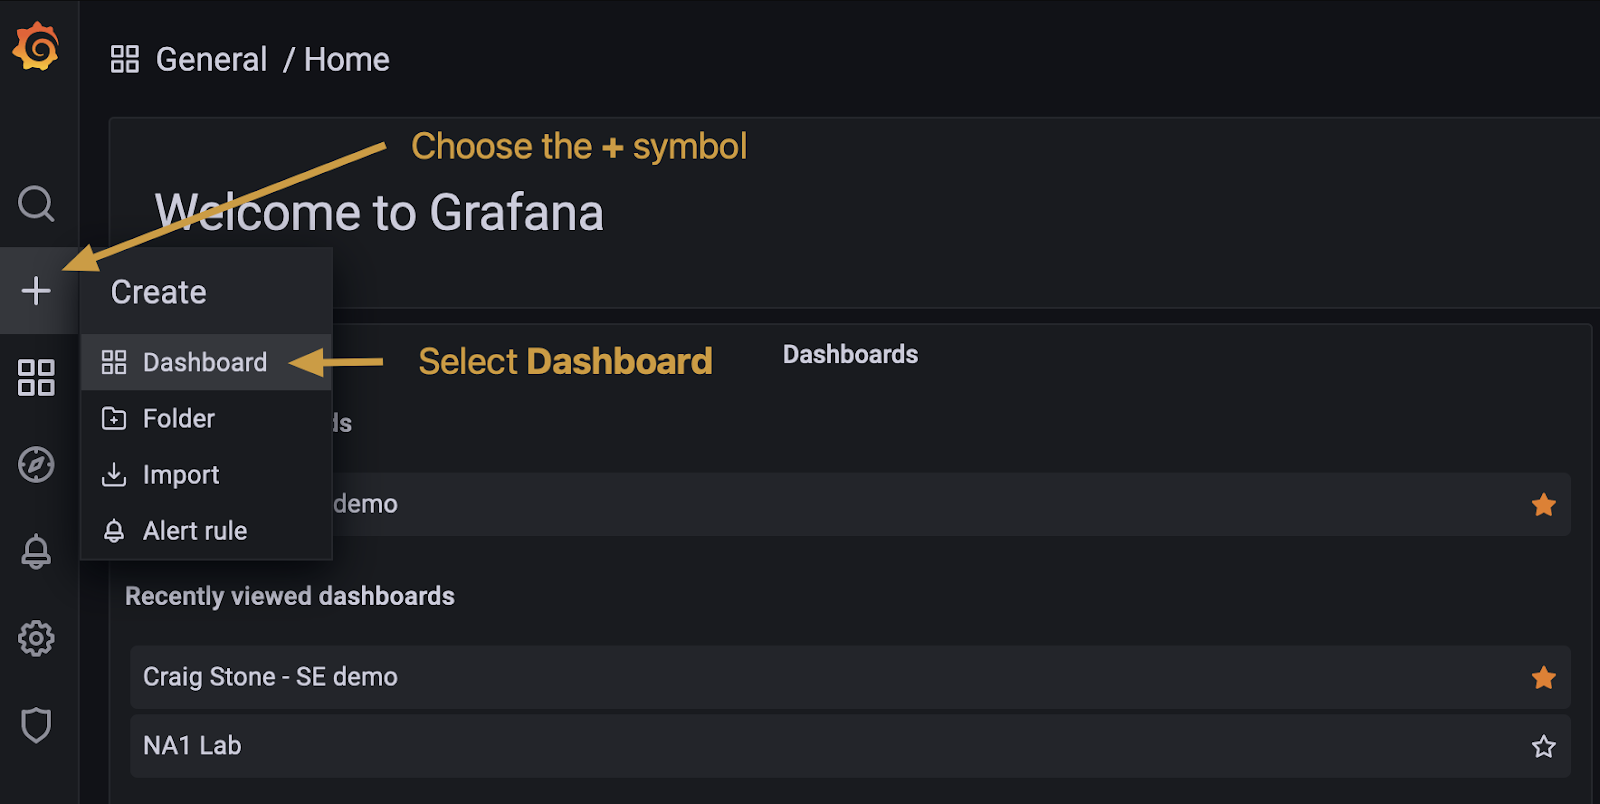
1. From the main menu in Grafana, click the + symbol, and select Dashboard.
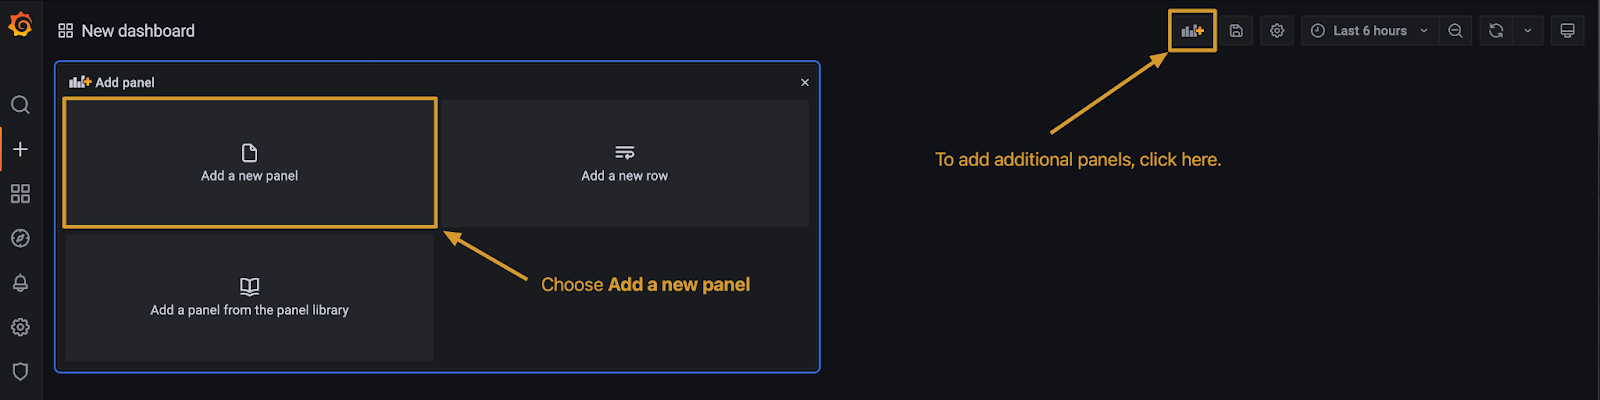
2. Choose Add a new panel.
3. Configure your specific data source for the Infinity plugin.
- In the Data source field, select the Infinity plugin data source that you set up in an earlier step. If you named the data source as we recommended, with the URL for the specific AppNeta application node or a friendly name such as
AppNeta <application-node>, you will see that name in the list. In the screenshot example, we named our data sourcedemo.pm.appneta.com. - In the Query options field, you can choose to customize the configuration settings. For example, you can modify how frequently you pull data from AppNeta by customizing the Interval field. See Grafana documentation for details on configuring queries.
- In the Parser list, choose Backend.
- In the URL field, enter an AppNeta API URL.
- For example, to pull data from all paths, enter
https://<application-node>.pm.appneta.com/api/v3/path/data, where<application-node>is the application node for your AppNeta instance. - To specify a single path, enter
https://<application-node>.pm.appneta.com/api/v3/path/<id>/data, where<application-node>is the application node for your AppNeta instance and<id>is the path ID of the path you would like to retrieve data for.
- For example, to pull data from all paths, enter
- See AppNeta Service Details for instructions to find your application node and AppNeta API for instructions to obtain path IDs.

4. Identify the correct Rows/Root values and Column values for the query. These values specify which rows and columns of data from AppNeta you want to visualize in Grafana. We explain how to do this and provide examples in the next section.
- We recommend entering Rows/Root value in JSONPath format:
$.<first-level>.<second-level>, where$. signals a row variable,<first-level>is the first level of the JSON formatted data you want to include, and<second-level>is the second level. For example, use$.data.latencyto visualize latency metrics. See the next section for more examples. - For Columns values, enter the values you want to visualize. Enter a metric name in the Selector field, the chart label for the metric in the as field, and the type of data in the formatted as field. Using latency values as an example, you would enter
startin the Selector field,Latencyin the as field, andNumberin the format as field.

5. Optionally, add paths or metrics by creating an additional query.
- Click the copy icon
in the top right corner of the form to duplicate the setup and create an additional query. Then, update the Rows/Root and Column values for the data you wish to add.
- Note: Each path or metric added creates an additional API query. See the UQL and JSONata section below for a possible solution to limit API queries.
6. The data is now shown in a chart in Grafana. Now you can customize the chart further by adding a title, changing design elements, and more.
Examples: Rows/Root and Column values
Grafana asks you to enter in Rows/Root and Column values when you are setting up your query. To do that properly, you need to be able to find the Rows/Root and Column values from the AppNeta API output. This section explains how to find the correct Rows/Root and Column values in AppNeta, and provides some examples you can use.
How to find Rows/Root and Column values in AppNeta
To find the values for a path and metric:
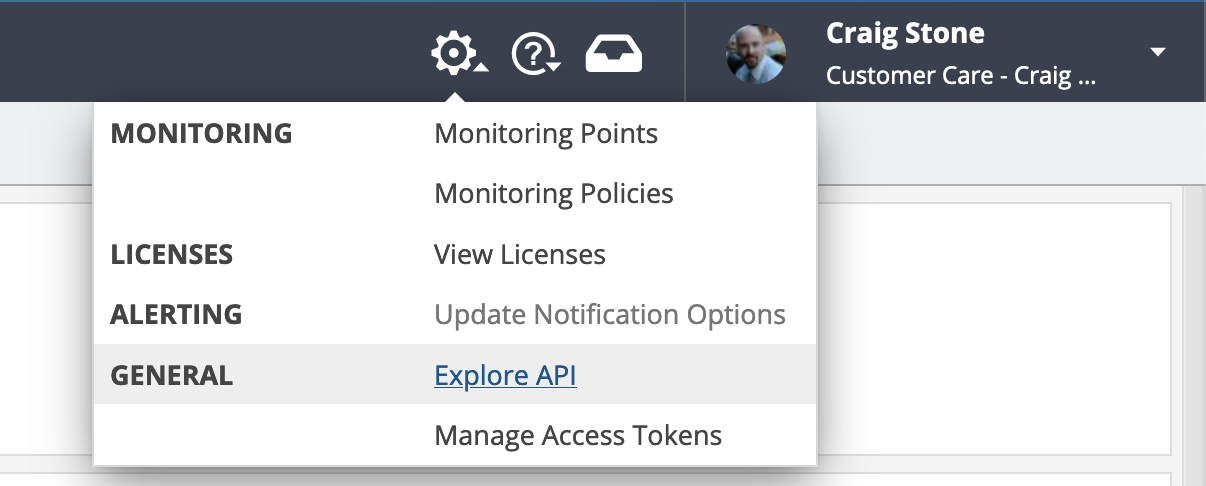
1. In AppNeta, navigate to the gear icon > Explore API.
2. Navigate to the desired endpoint and click Try it out.
- Select GET /v3/path/data to retrieve data for all paths in the organization.
- Select GET /v3/path/{id}/data to retrieve data for a specific path

3. If you choose to retrieve data for a specific path, enter its path ID number in the id field.
- Tip: See AppNeta API for instructions to obtain path IDs.

4. Select the metric of interest from the metric list and click Execute.

5. Use the API response to identify the Rows/Root values in Grafana. The output will contain the names of the variables for Grafana. Path data are nested variables within the path attributes.
- Use the format
$.<first-level>.<second-level>, where<first-level>is the first level of the JSON formatted data you want to include, and<second-level>is the second level. - For example, in the preceding screenshot, you can see that the variable
latencyis nested underdata. You would therefore input$.data.Latencyto Grafana to include latency in your visualization.

6. Use the API response to identify the Column values in Grafana.
- For example, to plot latency over time, include two columns: one for time, and one for the value of latency.
- For time, enter
startin the Selector field. Then enter a label, such asTime, and select a data type, such asTime (UNIX ms). - For latency, enter
valuein the Selector field. Then enter a label, such asLatencyand select a data type, such asNumber.
Inbound and outbound metrics
Keep in mind that some AppNeta metrics are collected in both monitoring directions—from the source Monitoring Point to the target, and from the target Monitoring Point to the source. These metrics are recorded as separate values:
- Source → Target (Outbound)
- Source ← Target (Inbound)
These must be called individually to collect those metrics for visualization. For example, data loss is a metric collected in both monitoring directions. To visualize both outbound and inbound data loss in Grafana, you would have to include both in your dashboard:
- Outbound:
$.dataOutbound.dataLoss - Inbound:
$.dataInbound.dataLoss
Example: Inbound voice jitter
To plot inbound voice jitter over time, we recommend using the following values.
- Rows/Root value:
$.dataInbound.voiceJitter - First Column values:
- Selector:
start - as:
Time - formatted as:
Time (UNIX ms)
- Selector:
- Second Column values:
- Selector:
value - as:
Voice Jitter - formatted as:
Number
- Selector:
Example: Outbound voice jitter
To plot outbound voice jitter over time, we recommend using the following values.
- Rows/Root value:
$.dataOutbound.voiceJitter - First Column values:
- Selector:
start - as:
Time - formatted as:
Time (UNIX ms)
- Selector:
- Second Column values:
- Selector:
value - as:
Voice Jitter - formatted as:
Number
- Selector:
UQL and JSONata
The Infinity plugin may not be the most efficient way to visualize AppNeta data in Grafana because it uses individual API queries for each data set. Instead, you may be able to use a UQL/JSONata enhancement that limits the number of API queries and visualizes your data more efficiently.
Cloud Observability’s Unified Query Language (UQL) is a language designed to query data from various sources in a universal manner. It is a powerful way to process metric data. JSONata is a lightweight query and transformation language designed specifically for querying and transforming JSON data. It provides a powerful and expressive toolset for navigating and manipulating JSON structures.
The Grafana Infinity plugin allows you to use either language to transform data. The way data is presented in the /v3/path/{id}/data feed is to separate each data type into its array of key-value pairs. Each pair has a timestamp with millisecond precision. This same timestamp seems to be present for all the different data types. Using these keys, it may be possible to correlate all the data points in the feed to a single table, allowing the presentation of all relevant data with one query.
AppNeta provides end-to-end visibility into your network performance
Part of the wider NetOps by Broadcom solution, AppNeta provides teams with the complete visibility they need to track network performance from end to end, no matter which networks user connections rely upon.
Use AppNeta’s powerful monitoring capability with Grafana to build real-time dashboards, so you can quickly see and understand performance issues on your network.
Follow these links to learn more about AppNeta’s features or request a demo. If you already have AppNeta, check out our training resources to learn more about using it and setting up integrations.

Craig Stone
Craig has spent over 20 years working with Managed Service Providers (MSPs) in multiple roles from technical to management. At Broadcom he is a network performance monitoring specialist. Craig helps large enterprises and solution integrators to leverage our DX NetOps and AppNeta platforms to expand observability,...
Other resources you might be interested in
Rally Office Hours: July 30, 2026
View this session to find out about the new query counter widget, custom list print card updates, dynamic Rally-to-Clarity mapping, and Q3 events.
What’s New in DX NetOps Topology: Summer 2026
See what’s new in DX NetOps topology. Leverage capabilities for expanded multi-vendor discovery, faster triage, custom views, and seamless data exports.
Rally Office Hours: July 23, 2026
Watch the Rally Office Hours from July 23, 2026, featuring updates on custom page migration, governance work rules tips, and upcoming widget releases.
Rally Office Hours: July 16, 2026
This July 16, 2026 Rally Office Hours session highlights a new custom pages substitution variable, custom page migration updates, and community Q&A.
Controlling Flow Telemetry Overhead in Distributed Environments
See how the latest updates to NetOps Flow reduce telemetry overhead and optimize WAN usage. Simplify data extraction and integration with the OData 4 API.
Clarity: Managing Reports
This course is designed for report consumers who need to access, analyze, and manage published reports in Clarity.
Automic Integration Brochure
This brochure serves as your guide to the diverse tools, platforms, and systems that can connect seamlessly with Automic.
Clarity: Configure Reporting Data Sources Using Data Providers
This course explains the data foundation that supports Reporting in Clarity. Learn how Data Providers prepare, organize, secure, and validate reporting data.
Rally Office Hours: July 9, 2026
This session covers the general availability of milestone delivery confidence, troubleshooting for custom views and admin functions, and upcoming webinars.