| Additional contributor: Sasanka Pusapati |
|
Key Takeaways
|
|
Microservices architecture has become a dominant approach for building scalable, resilient, and flexible applications. However, monitoring these microservices presents unique challenges due to their distributed nature, fixed or limited resources, enterprise scale, and the dynamic nature of environments, such as Kubernetes clusters. The result is that in-process application agents often introduce significant overhead because they rely on intrusive instrumentation and frequent polling. Quite simply, they are heavy agents.
Adopting microservices (eBPF) agents for monitoring helps teams address critical needs for a low-overhead, real-time, and non-intrusive monitoring solution in dynamic and resource-constrained environments. eBPF agents are lightweight and powerful!
Before diving into the enchanting world of eBPF monitoring, let’s unravel the mystery of eBPF itself. Imagine eBPF as a magical lens—a way to peer into the inner workings of your Linux system for cloud-native observability. Here’s what the eBPF agent can do:
- System calls and network traffic: eBPF can monitor system calls, network traffic, and system behavior in real time. It’s like having a wizard’s crystal ball that reveals hidden secrets.
- Granularity galore: With eBPF, you can trace performance data on a process-by-process basis. Whether for individual containers, specific processes, or entire applications, eBPF offers unparalleled granularity.
- Security sorcery: Some IT solutions wield eBPF for runtime security auditing and incident response. It’s the guardian at the castle gates that ensures your system stays safe.
Feature comparison of in-process and eBPF agents
| Feature | In-process agent | eBPF agent |
| Agent execution space | Inside application (user-space) execution | Outside monitoring |
| Overhead and performance impact | Higher overhead; intrusive | Low overhead; non-intrusive |
| Scope of monitoring | Application-specific monitoring; limited to the application | System-wide monitoring; application-agnostic |
Architectural comparison

eBPF agent: A powerful solution for cloud-native monitoring
DX Operational Observability (DX O2) helps teams contend with the explosive growth in monitoring data, infrastructure complexity, and business demands. The product enables end-to-end observability across the entire digital delivery chain and empowers IT operations teams with actionable insights to efficiently manage modern and complex environments.
The eBPF agent is a powerful addition to the DX Operational Observability ecosystem. It provides dynamic instrumentation by inserting probes into the running system, without requiring restarts or recompilation. Here are some key features:
- Dynamic instrumentation: The eBPF agent dynamically inserts probes into the system, allowing on-the-fly instrumentation. This avoids disruption since there is no need for teams to restart or recompile applications.
- Kernel-level metrics collection: The eBPF agent leverages Linux kernel-level API calls that are consistent across all hosts in the cluster. This ensures uniform collection of observability metrics. To help teams monitor the health and performance of applications, it provides three key performance indicators (KPIs):
- Responses per interval
- Errors per interval
- Average response time

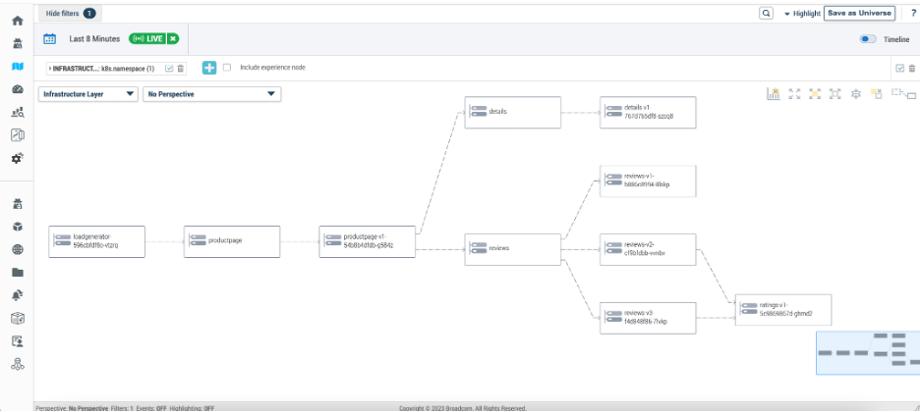
- Language-agnostic, broad support: The eBPF agent natively supports applications built using Java, .NET, PHP, NodeJS, Python, Golang, or C++. With native support for these widely adopted technologies, eBPF can readily correlate the full stack monitoring data it gathers as transactions transverse complex IT estates. Teams benefit from an intuitive presentation of the application flow topology.
- Near-zero overhead: The agent sits outside the application pod. This minimizes overhead while still providing valuable insights.
Universal Monitoring Agent (UMA) features a microservices agent that runs as part of UMA daemonset pods (app-container-monitor). The UMA acts as a single agent deployment that automatically discovers and monitors Kubernetes and Red Hat OpenShift containers, applications, and cluster services.

The eBPF agent: Innovative, powerful, and enchanting!
The new eBPF monitoring agent provides comprehensive insights into the performance and interactions of frontends, backends, and application flows (AppFlow). It provides teams with outside-in monitoring of applications for cloud-native observability, without requiring changes to the applications.
There will be situations where in-process agents provide distinct benefits. However, given changes in application architectures and the monitoring needs and constraints that teams face, these occasions are more the exception than the norm. Choosing between a microservices (eBPF) agent and an in-process application agent depends on your specific requirements, such as the level of detail needed, the acceptable overhead, and whether system-wide or application-specific monitoring is desired.

Ravina Khanna
Ravina Khanna is a Product Manager on the AIOps and Observability team at Broadcom. She covers a number of technology areas including ingestion agents for application performance management and synthetic monitoring. She applies her extensive experience building and managing enterprise products to extend solution...
Other resources you might be interested in
This Halloween, the Scariest Monsters Are in Your Network
See how network observability can help you identify and tame the zombies, vampires, and werewolves lurking in your network infrastructure.
Your Root Cause Analysis is Flawed by Design
Discover the critical flaw in your troubleshooting approaches. Employ network observability to extend your visibility across the entire service delivery path.
Whose Fault Is It When the Cloud Fails? Does It Matter?
In today's interconnected environments, it is vital to gain visibility into networks you don't own, including internet and cloud provider infrastructures.
The Future of Network Configuration Management is Unified, Not Uncertain
Read this post and discover how Broadcom is breathing new life into the trusted Voyence NCM, making it a core part of its unified observability platform.
Rally Office Hours: October 9, 2025
Discover Rally's new AI-powered Team Health Widget for flow metrics and drill-downs on feature charts. Plus, get updates on WIP limits and future enhancements.
AAI - Navigating the Interface and Refining Data Views
This course introduces you to AAI’s interface and shows you how to navigate efficiently, work with tables, and refine large datasets using search and filter tools.
Rally Office Hours: October 16, 2025
Rally's new AI-driven feature automates artifact breakdown - transforming features into stories or stories into tasks - saving time and ensuring consistency.
What’s New in Network Observability for Fall 2025
Discover how the Fall 2025 release of Network Observability by Broadcom introduces powerful new capabilities, elevating your insights and automation.
Modernizing Monitoring in a Converged IT-OT Landscape
The energy sector is shifting, driven by rapid grid modernization and the convergence of IT and OT networks. Traditional monitoring tools fall short.