
Learning Path
Tame the Complexity of Software-Defined WANs and Hybrid Networks
This learning path provides foundational information and links to resources to support implementing the solutions highlighted in the Tame the Complexity of Software-Defined WANs and Hybrid Networks white paper.

Tame the Complexity of Software-Defined WANs and Hybrid Networks
Use Case Overview
The Network Observability by Broadcom Approach
SD-WAN Migration and Monitoring Phases
Steps to Implement Network Observability by Broadcom
Example Workflow: Monitoring Site, Tunnel, and Application Performance
Conclusion
As network operation teams increase their dependency on cloud-based service models, software-defined wide area networking (SD-WAN) technology is being adopted to resolve WAN bottlenecks, and to create a distributed networking environment that supports cloud transformation with lower costs and commercially available Internet access.
|
Challenge: While SD-WAN is a cost-effective and flexible alternative to traditional WANs, the high rate of failed deployments indicates that achieving a successful implementation is not as straightforward as it seems. One survey shows only 38% of IT professionals believe their SD-WAN implementations have been fully successful. |
The primary reasons for failed SD-WAN implementations are:
Increased Complexity
Network operations become overwhelmed with the growing number of tunnels connecting remote branches to critical cloud applications as organizations become less reliant on data centers to secure and route internet-bound traffic from remote offices and branches.
Limitations of Native Management Tools
Network teams face challenges in maintaining visibility into multi-vendor landscapes and identifying and addressing performance issues that occur along network delivery paths due to the fact that many native SD-WAN platforms can only monitor from network edge to network edge for one specific SD-WAN technology.
Dynamic Traffic Patterns
Network teams are limited in their ability to pinpoint the root cause of performance degradation due to native SD-WAN management tools offering only limited visibility into the overlay, and often lacking insight into the underlay, particularly for circuits operated by third-party providers.
Skill Gaps
Due to the lack of internal skills, network teams rely on service providers, or outsourced network management providers, without the domain expertise to understand the specific requirements of the organization to deploy SD-WAN.
To address these challenges, Network Observability by Broadcom integrates the DX NetOps and AppNeta platforms to create a complete solution capable of monitoring the performance of a vast number of WAN and SD-WAN vendors, along with the performance of the traffic flowing through the circuits inside the data center, and the circuits outside the data center as they access cloud solutions through ISPs.
The WAN, SD-WAN, and traffic performance data are displayed in the DX NetOps Portal in easy-to-understand views. Views can be configured with baseline performance thresholds based on performance requirements determined by the organization in order to quickly identify performance degradation. Alarms can also be configured to notify teams of critical issues with the goal of resolving the issue before an outage occurs.
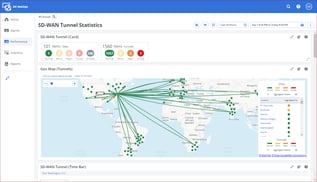
Figure 1: The SD-WAN Tunnel Statistics dashboard with the SD-WAN tunnels displayed on a Geo Map view in DX NetOps Portal.
The data collected from the network can be organized into logical groups, such as all the network items at a physical location. The data from these groups can be displayed on customized dashboards and views, organizing complex networks into manageable subsections, and network teams can be assigned specific dashboards so they only see the data they need to see and are not overwhelmed with the complexities of the entire network.
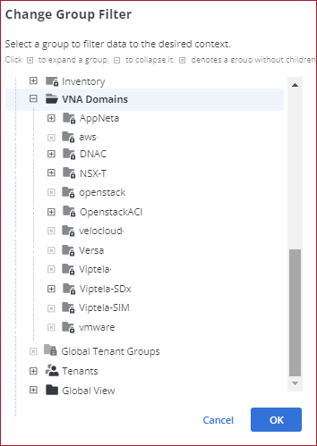
Figure 2: Example of groups organizing network items by SDN technology.
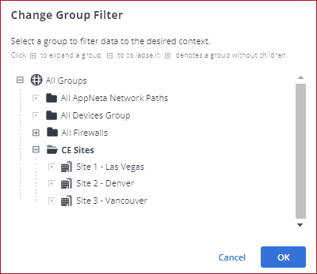
Figure 3: Example of groups organizing network items by type and by geographic location.
Using the Network Observability by Broadcom solution, the complexity of monitoring the modern network is unified and simplified, providing network operations teams the data they need, in the formats they need, to rapidly identify and resolve issues, and optimize the network to ensure an optimal end-user experience.
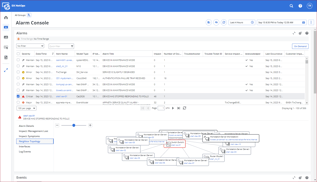
Figure 4: Example of an Alarms view displaying information about a selected alarm including topology of neighboring devices.
To learn more about how Network Observability by Broadcom addresses the challenges of monitoring and managing the complexity of the modern network, read the white paper: Tame the Complexity of Software-Defined WANs and Hybrid Networks.
Learning Path objective
This learning path provides foundational information and links to resources to support implementing the solutions highlighted in the Tame the Complexity of Software-Defined WANs and Hybrid Networks white paper. The learning path is designed to walk network operations teams—new to the Network Observability by Broadcom solution—through the end-to-end process of configuring the solution for WAN/SD-WAN monitoring, starting from a new deployment.
The Network Observability by Broadcom approach supports the process to migrate from a WAN to a WAN/SD-WAN hybrid environment, along with supporting the process of continuously monitoring and improving network performance.
To accomplish this, the solution consists of the network monitoring platforms, DX NetOps and AppNeta.
DX NetOps
DX NetOps is a collection of software components that are deployed individually on-premises and integrated together to create the DX NetOps platform, which monitors the underlay and overlay of the managed side of the network within the data center.
The following DX NetOps software components are deployed and integrated to provide the monitoring capabilities:
- DX NetOps Performance Management to monitor the performance of network items, such as devices, their components, and their interfaces.
- DX NetOps Spectrum to map the topology of the underlay and overlay, and to generate events and alarms from faults, SNMP traps, and custom criteria.
- DX NetOps Virtual Network Assurance to connect to software-defined networking (SDN) controllers and collect the inventory, SLAs, and performance data for various SDN technologies.
- NetOps Flow to collect flow data on the managed side of the network sent from devices using the Internet Protocol Flow Information Export (IPFIX), NetFlow by Cisco, or sFlow formats.
When integrated together, the DX NetOps software components:
- Discover physical, virtual and logical components of the network, inventories these items, and determines relationships between them
- Monitor the performance of these items in order to detect problems or proactively plan to avoid them
- Monitor the condition of these items through continuous polling and interrogation
- Process events by way of SNMP traps, syslogs, and so on to determine areas that need immediate attention and generate alarms for these areas when necessary
- Monitor the traffic in key parts of the network
- Provide reporting that can be automated and delivered via email on a set schedule
AppNeta
AppNeta is a SaaS-hosted platform with on-premises hosting options for more security-conscious organizations, and monitors the managed side of the network within the data center, and the unmanaged side of the network when it crosses over to the internet to access cloud services and applications.
While DX NetOps monitors by way of polling and interrogating network items, or connecting to SDN controllers to collect performance data, AppNeta deploys Monitoring Points at end-user locations on the network. These Monitoring Points are physical hardware devices with network interfaces; and virtual devices that run either in virtual or container environments, or as an application on an operating system.
AppNeta actively measures application and network performance from the end-user perspective by synthetically generating network traffic from Monitoring Points, allowing for proactive detection of issues across managed and unmanaged networks. Certain Monitoring Points can also passively monitor live traffic on a network to determine which applications are being used, who is using them, and to report on the amount of bandwidth consumed by a given application, host, or user.
Using Monitoring Points for SD-WAN monitoring, AppNeta is capable of providing underlay performance validation, overly performance monitoring with the ability to perform trust and verify activities, and end-to-end visibility across all error domains such as LAN, WAN, SD-WAN, cloud, and so on.
The monitoring capabilities of AppNeta Monitoring Points are broken into three categories: Delivery, Experience, and Usage monitoring.
- AppNeta Delivery Monitoring assesses the performance and condition of the network from the perspective of transporting application data.
Application data travels back and forth through the network between a source (for example, a user workstation) and a target (for example, an application running on a server). AppNeta monitors the path this data takes through the network between the source and target (all the network devices or “hops” it passes through).
To monitor network paths—all the hops between a source and target—are monitored by deploying AppNeta Monitoring Points. Monitoring Points act as one or both of the source and target endpoints. Then, a network path is created in AppNeta identifying the path between the source and the target as the one to monitor.
Once monitoring is in place, the patented TruPath™ technology in Continuous Path Analysis (CPA) mode is used to periodically (typically once per minute) measure a number of network path performance metrics and pass these metrics back to AppNeta for analysis. When metric data is outside the acceptable limits, AppNeta can be configured to send alert notifications. Also, once TruPath runs a diagnostic test—known as Deep Path Analysis (DPA)—on the affected path to help determine where and why it is performing poorly. The data is presented on a variety of web pages and reports within AppNeta, and is also shared with DX NetOps and displayed in DX NetOps Portal.
- AppNeta Experience Monitoring actively provides performance data on how web applications are performing from the perspective of end-users or client applications interacting with the applications.
To accomplish this, Monitoring Points execute transactions that emulate user or client interactions with an application. Transactions are generated by workflows, which can be of two types: Browser workflows and HTTP workflows.
Browser workflows simulate end-user interactions with a web application as though an end user is interacting with a web page in the application such as stepping through a process in the application.
HTTP workflows simulate API or direct web service HTTP requests from the target applications using GET, PUT, or POST commands.
The workflows are executed at regular intervals providing active performance monitoring of the applications to provide continuous insight into application performance regardless of the actual live traffic. The data collected by Experience Monitoring shows the state of the applications currently, and how application performance changes over time, such when changes are made to the network, to the servers running the applications, or to the applications themselves. The data is also provided to DX NetOps and displayed in DX NetOps Portal.
Additionally, alerts can be configured to notify network operators when the performance of an application is outside acceptable limits.
- AppNeta Usage Monitoring provides a view into the live traffic passing through a network using physical or virtual Monitoring Points with ports dedicated to Usage Monitoring. Unlike the Experience and Delivery Monitoring capabilities, Usage Monitoring is passive monitoring as it only monitors actual live traffic, and does not actively generate synthetic traffic.
Monitoring Points connected either inline, or to a SPAN or mirror port, generate traffic flow records based on the source IP address, destination IP address, source port, destination port, Type of Service (ToS), and protocol. The Monitoring Points send the flow records to AppNeta. Using Deep Packet Inspection (DPI), AppNeta identifies, classifies, and categorizes the applications based on a library of more than 2000 application definitions. Usage Monitoring also calculates traffic volume information for the individual applications, application categories, application hosts, and so on. In addition to traffic volume monitoring, Usage Monitoring can also capture packets in order to provide even greater detail on traffic flow.
The Complete Network Observability by Broadcom Solution
To create the complete Network Observability by Broadcom solution, and to monitor from end-to-end on the managed and unmanaged sides of the network, DX NetOps and AppNeta are integrated together where they collectively provide the capabilities to:
- Monitor WAN and SD-WAN multi-vendor infrastructures
- Monitor multi-edge infrastructures
- Monitor the performance of both the overlay and underlay
- Map the topology of layer 2 and layer 3 network devices for visibility across complex SD-WAN environments
- Scale to monitor 200k+ SD-WAN tunnels
- Actively monitor the end-to-end network performance of the SD-WAN underlay
- Perform deep packet inspection for application identification and visibility into network utilization
- Generate synthetic web transactions to validate layer 7 application performance across SD-WANs
- Actively validate voice performance across SD-WANs
- Create custom events and alarms based on performance baseline thresholds to distinguish between optimal and suboptimal performance for automated anomaly detection
- Create streamlined workflows for network monitoring and rapid issue resolution
- Integrate with 3rd-party help desk ticketing systems to provide automated, real-time updates as problems are triaged and resolved
- Actively validate the effectiveness of an SD-WAN deployment before, during, and after roll-out
To simplify workflows and provide a single UI for monitoring the entire network and performing issue resolution, DX NetOps and AppNeta data is integrated and displayed in the DX NetOps Portal web UI.
For an overview of the Network Observability by Broadcom experience-driven approach to network monitoring, refer to the online course: Experience-Driven NetOps: Overview 100.
Network Observability by Broadcom Web UIs
During the deployment and configuration process, the following web UIs are used to configure network monitoring and alarm generation:
- DX NetOps Portal
- DX NetOps Spectrum OneClick
- AppNeta
These web UIs are used during the configuration process, but once the solution is configured, DX NetOps Portal is typically the only UI needed for viewing performance data and managing alarms. DX NetOps Portal does provide links to the other UIs when necessary.
DX NetOps Portal
To streamline the network monitoring workflows, the performance data, events, and alarms from DX NetOps Performance Management, DX NetOps Spectrum, DX NetOps Virtual Network Assurance, and AppNeta are integrated and displayed in the DX NetOps Portal web UI.
| Note: DX NetOps Portal is deployed with the DX NetOps Performance Management software component of DX NetOps, and Portal is also used to configure Performance Management. |
Using DX NetOps Portal, network operators can perform the day-to-day tasks of monitoring the health of the network and responding to alarms and major network events. Network planners can use DX NetOps Portal to identify areas where the network can be improved.
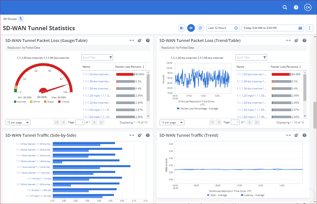
Figure 5: Example of a dashboard and views in DX NetOps Portal.
The key features of DX NetOps Portal are:
- Data integration: DX NetOps Portal integrates data from DX NetOps Performance Management, DX NetOps Spectrum, DX NetOps Virtual Network Assurance, and AppNeta to provide end-to-end coverage of the network in a single UI.
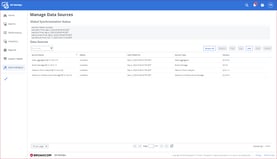
Figure 6: Example of different data sources connected to DX NetOps Portal. - Inventory folders: Each network item that provides data is added to the DX NetOps Portal inventory. Inventory folders automatically organize all the network items in the inventory into logical categories.
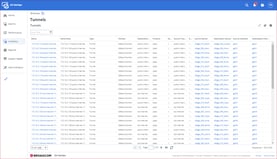
Figure 7: Example of the Tunnels inventory page listing all the SD-WAN tunnels in the DX NetOps Portal inventory.
- Dashboards: Dashboards are pages used to organize sets of views that focus on a specific aspect of the network, such as SD-WAN tunnels or sets of interfaces. The views on a dashboard can include performance data, alarms, events, and inventory folders.
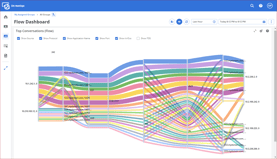
Figure 8: Example of a dashboard in DX NetOps Portal. - Views: Views are panes which typically focus on a single metric or a small number of metrics gathered from monitoring multiple network items. The data from the network items listed in a view is analyzed and displayed in the view as aggregated summaries, hourly rollups, trends, averages, and so on, which are displayed in different formats, including tables, multi-line charts, gauges, heat charts, scorecards, maps, and more. The goal of a view is to provide at-a-glance information about the health of that aspect of the network and provide links from the view to dive deeper into the data.
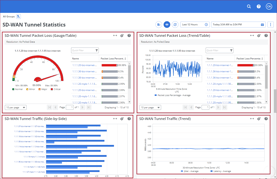
Figure 9: Example of view on dashboards in DX NetOps Portal. - Alarms and Events views: Network events are captured by DX NetOps and displayed in Events views. Events that are determined to be anomalies on the network can be converted to alarms, and the alarms are displayed in an Alarms view. Alarms views also have features to help with triage, issue resolution, and ticket management. Groups can be used to set the data context of event and alarm views to reduce data on the views to only events and alarms from the network items in the group.
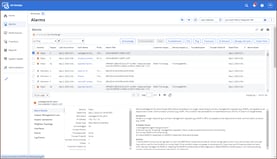
Figure 10: Example of an Alarms view displaying information for a selected alarm. - Context pages: Context pages contain the data for all the metrics collected for a single network item such as router or an SD-WAN tunnel. When a network item is discovered by the DX NetOps platform, the item is cataloged in the DX NetOps inventory, and a context page is created for that item with all the data for all the different metrics collected for the item. Using context pages, you can drill down into the deep sets of metrics collected for a network item to assist with troubleshooting and optimization.
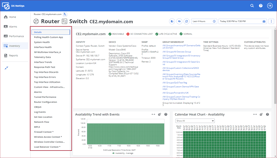
Figure 11: Example of a context page. The metrics for the router are organized and listed in the left pane. - Groups: Groups organize the monitored network items in the DX NetOps inventory into logical categories, creating datasets with data from only the network items in the group. Groups are used to set the data context for a dashboard or view. For example, a group can be created containing all the SD-WAN tunnels for a geographic location, and the data from the tunnels in the group is used to set the data source for a dashboard designed for monitoring the health of the tunnels so the dashboard only displays data from the tunnels in the specified location.
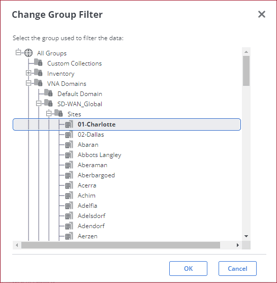
Figure 12: Example of available groups to select for the data source for a dashboard.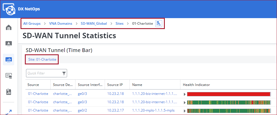
Figure 13: Example of a dashboard where the 01-Charlotte site group is providing the data for the dashboard and views. - Threshold profiles: Threshold profiles are configured to generate alarms when the performance of an aspect of the network crosses over a performance baseline. For example, a threshold profile can be configured to trigger an alarm when a path exceeds performance criteria specified in an SLA. Threshold profiles have groups assigned to them to define which network items to monitor for the threshold criteria.
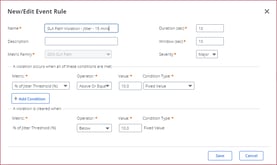
Figure 14: Example of creating a threshold profile and defining the criteria to create an event, which can also trigger an alarm. - User roles: User roles define the permissions users have in DX NetOps Portal. A user role can define admin permissions, access to groups, access to dashboards, and the navigation scheme. User roles help to provide some roles with limited admin access, and also streamline the user experience by only allowing access to only the dashboards and groups necessary for the role. For example, a user role could be created for a specific physical location that only allows access to dashboards and network items related to that location, streamlining the role to only what is needed to monitor that location.
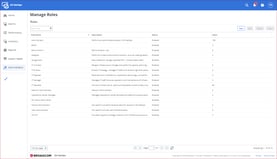
Figure 15: Example of roles users can be assigned to in DX NetOps Portal.
For a tour of DX NetOps Portal functionality, refer to the online course: Getting Started with DX NetOps Portal.
DX NetOps Spectrum OneClick
The DX NetOps Spectrum OneClick web UI is responsible for configuring and displaying alarms from network events along with topology views of the network to show the relationship between devices. OneClick can configure the consolidation of multiple events into a single alarm to reduce alarm noise, capture of SNMP traps to generate alarms, and show the impact of a problem device on its neighbors using topology views. This data from OneClick is integrated and displayed in DX NetOps Portal, so typically only admins access OneClick for configuration purposes, and operators and planners use DX NetOps Portal to view the integrated data and alarms from OneClick.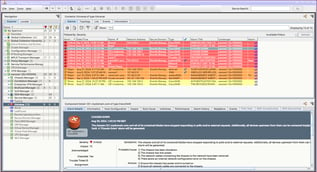
Figure 16: Example of an alarms view in DX NetOps Spectrum OneClick.
For a tour of DX NetOps Spectrum OneClick functionality, refer to the online course: DX NetOps 23.3.x: Navigating OneClick for Spectrum.
AppNeta Web UI
The AppNeta web UI is used to deploy and configure Monitoring Points on the network as well as configure and generate alerts for network anomalies. The Monitoring Points can generate synthetic traffic and application usage to actively monitor the network, and passively monitor traffic in real-time as well. The data from the Monitoring Points and the performance alerts are sent to DX NetOps Portal where the data is integrated with data from other sources. 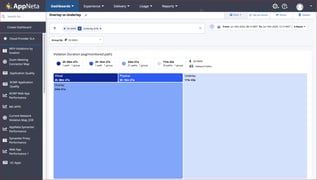
Figure 17: Example of a dashboard in AppNeta.
For a tour of AppNeta functionality, refer to the online course: Introduction to AppNeta.
The implementation of Network Observability by Broadcom for end-to-end coverage of both the WAN and SD-WAN aspects of network monitoring is a three-phase process divided into "days" to represent the phases:
- Day 0 - Before SD-WAN Migration. This phase defines the SD-WAN migration plan, determines roles and responsibilities, estimates the size of the network after migration, defines performance baseline criteria, and ensures the network systems and the Network Observability by Broadcom solution are scaled to manage the increased performance load during and after SD-WAN migration.
- Day 1 - During SD-WAN Migration. This phase is the actual migration to SD-WAN. In this phase, as the migration takes place, the network is monitored and validated to ensure the SD-WAN performance meets expectations and changes are made as needed. Additionally, with live SD-WAN data in DX NetOps Portal, monitoring configurations can be implemented in Portal, such as organizing data with groups, creating custom dashboards for specific monitoring needs, and setting up schedule reports.
- Day 2 - After SD-WAN Migration. This phase marks the end of the SD-WAN migration and the beginning of the continuous monitoring and optimization of the network.
Day 0 -Before SD-WAN Migration
The activities in the Day 0 phase define the size of the network after SD-WAN migration, the migration plan, roles and responsibilities, performance baseline criteria, and ensures the network systems and the Network Observability by Broadcom solution are scaled to manage the increased performance load during and after SD-WAN migration.
Sizing
Migrating to SD-WAN can significantly increase the size of the network. In order to understand the scope of the changes to the network and to plan accordingly, perform a sizing exercise to estimate the increase in size of the network after migration to SD-WAN.
Sizing examples:
SD-WAN Full Mesh Topology
200 (sites) x 200 (sites) x 2 (edge routers) = 80,000 models (tunnels)
80,000 Tunnels with 4 defined SLAs = 80,000 x 4 = 320,000 models (SLAs)
In this full mesh example, 80,000 Tunnels + 320,000 SLAs represents an increase of a total of 400,000 new models for a performance monitoring system to monitor.
SD-WAN Star Topology
200 (sites) x 2 (data centers) x 2 (edge routers) = 800 models (tunnels)
800 Tunnels with 4 defined SLAs = 800 x 4 = 3,200 models (SLAs)
SD-WAN Partial Mesh Topology
200 (sites), 200 (sites), 2 (data centers), 2 (edge routers)
The SD-WAN Partial Mesh Topology scale is strictly dependent upon the number of sites using Full Mesh and the number of sites using Star Topology, and the number of sites using a combination, with the results being somewhere between the two topology types described above.
After completing a sizing exercise:
- Collaborate with network architects and provide site survey details for them to make the best decisions for deploying the network
- Validate the Network Observability by Broadcom deployment is architected to handle the increased performance load of monitoring the additional SD-WAN components and scale the deployment to meet the performance demands if necessary.
Planning Considerations
After completing the sizing exercise, consider the following when developing the migration plan and configuring dashboards, alarms, and custom reports in DX NetOps Portal:
- Migration to SD-WAN is often completed in phases and can take weeks, months, or even years
- Network engineers will either migrate sites from legacy WAN technologies to SD-WAN, or to build new sites using SD-WAN
- During and after migration, plan to monitor the performance of a hybrid network that consists of both WAN and SD-WAN technologies
- Critical issues will happen with the SD-WAN network that requires visibility into the performance of the network that will require configuring alarms and utilizing an integrated incident ticketing system in DX NetOps Portal
- Operation leads will need regular reports on the health of the network
- Leadership will need reporting comparing historical and current performance of the SD-WAN architecture vs. the previous traditional WAN network
Roles and Responsibilities
In the planning process, define the SD-WAN migration roles and responsibilities for:
- Designing, implementing, and maintaining the SD-WAN network monitoring infrastructure
- Continuously monitoring underlay and overlay network performance and identifying and resolving network issues
- Establishing baseline performance criteria of existing network to understand if network changes impact end user experience
- Conducting continuous network assurance checks to ensure compliance with SLA policies for all types of traffic across all sites
- Coordinating with other IT teams for effective network integration
- Ensuring that the network is optimized for maximum performance and reliability
- Providing performance reports for performance assessments as well as optimization planning and validation
Performance Monitoring Planning
The performance monitoring team should plan to contribute the following to the design and development teams:
- Device staging, testing, and rollout implementation plan
- Global connectivity needs assessments
- Site surveys including bandwidth, latency, and jitter to establish network performance requirements
- Network topology, device configurations, and security policies
- Performance thresholds for deviations from normal performance used to trigger alarms
Metrics to Capture for Dashboards and Reports
In DX NetOps Portal, dashboards and their views provide the network performance data which can be used for onscreen, at-a-glance reporting, or the data can be exported and emailed on a schedule. DX NetOps Portal also provides the ability to create and distribute custom reports.
In order to ensure the reporting requirements of NetOps teams and leadership are captured and displayed in DX NetOps Portal, determine the performance metrics to collect, and using the metrics, plan dashboard, view, and custom report designs to display the metrics in meaningful formats for the different monitoring needs and audiences.
Designing the Network Groups for DX NetOps Portal
In DX NetOps Portal, the groups feature provides the ability to organize network items into logical groups, such as similar devices or all network items associated with a physical site. The groups then become the data source for dashboards, views, and reports.
Design how the network will be organized in DX NetOps Portal using the groups feature as the SD-WAN components are migrated into the WAN.
For example, to view the data for all the network items at a physical site, the WAN and SD-WAN network items for the site can be members of a single group, and a dashboard created to display the comprehensive health of the site based on the metrics in the group.
Defining Monitoring Requirements
Define the performance metrics required for issue identification and resolution, performance reporting, and network optimization in addition to the performance baselines for the network before, during, and after migration.
Monitoring Performance Validation and Scaling
Validate the Network Observability by Broadcom solution meets the performance requirements for the estimated size of the network during and after migration. If necessary, scale the Network Observability by Broadcom platforms to match the required performance requirements. Before the first SD-WAN migration takes place, ensure the Network Observability by Broadcom solution is deployed to its production state so the solution is ready to discover, validate, and monitor the migration.
Day 1 - During SD-WAN Migration
The Day 1 phase is when the SD-WAN migration takes place. As the SD-WAN components are added to the network, the components are also added to DX NetOps inventory where the components are monitored for performance.
At this point, with actual SD-WAN items to monitor, DX NetOps and AppNeta can be configured to monitor the SD-WAN items and provide performance data for the migration. For example, in DX NetOps, groups, dashboards, and alarms can be configured, and in AppNeta, Monitoring Points deployed to monitor traffic performance.
The configuration steps are listed later in this learning path under the topic: Steps to Implement Network Observability by Broadcom to Tame the Complexity of Software-Defined WANs and Hybrid Networks.
In this phase, as the network transforms from WAN to a WAN/SD-WAN hybrid, it is critical to use the solution to continually validate the network performance and the end-user experience, implementing fixes and optimizations as needed.
Also expect to provide reporting to leadership comparing the historic WAN performance to the performance of the network as the migration to SD-WAN takes place.
Day 2 - After SD-WAN Migration
The Day 2 phase begins when the migration completes. In this phase, expect to continuously monitor the WAN/SD-WAN hybrid network and perform maintenance and updates in order to continually provide the optimal end-user experience; develop and deploy new SD-WAN threshold policies that include both the SD-WAN underlay and overlay components, models, and metrics; and to regularly review incident data to identify trends and potential areas for improvement.
Steps to Implement Network Observability by Broadcom to Tame the Complexity of Software-Defined WANs and Hybrid Networks
In this learning path, the implementation instructions start from a fresh install of the Network Observability by Broadcom solution. In this scenario, all the required DX NetOps software components are installed and integrated with each other, and AppNeta is integrated with DX NetOps.
Additionally, in the fresh install, the WAN network is not discovered yet, VNA does not have a plug-in configured to collect SD-WAN performance data, and NetOps Flow and AppNeta Monitoring Points have not been instrumented yet to capture traffic performance data. These actions are covered in the steps below.
|
Note: Typically, the design, installation, and configuration of DX NetOps, and integration with other tools such as AppNeta, is completed by a certified Broadcom Services Partner. From there, the network operations teams within the organization configure the solution to meet the monitoring requirements of the organization. |
To learn more about DX NetOps architecture, installation, and configuration, refer to the learning path: DX NetOps Installation and Configuration.
To learn how to integrate DX NetOps and AppNeta, refer to the online course: DX NetOps 24.3.x: Integrate AppNeta.
1. Perform Sizing Exercises
Verify the DX NetOps deployment is sized to meet the performance requirements to monitor the complete WAN/SD-WAN environment. After sizing the DX NetOps deployment, provision additional resources if needed.
For more information on sizing DX NetOps, refer to the following documentation pages:
- DX NetOps Performance Management Cloud Sizing
- DX NetOps Spectrum Sizing
- DX NetOps Virtual Network Assurance Plug-in Sizing
2. Discover the WAN
Discovery is the process of DX NetOps finding and inventorying the items to monitor for performance and faults.
Discovery can be performed using DX NetOps Spectrum and DX NetOps Performance Management. Both Spectrum and Performance Management use SNMP and ICMP calls to find network items on the WAN to inventory and monitor.
Spectrum monitors for faults, and Performance Management monitors the same items for performance, however, because each system has a different role, each system creates its own inventory of items to monitor using different data schemas.
In order to ensure the two systems inventories are in synch and the systems are monitoring the same network items, the following is an example of the discovery process:
- A discovery run is configured in DX NetOps Spectrum OneClick
- The run is executed, and uses SNMP and ICMP calls to search the WAN network and discover all the devices within IP ranges that respond to the calls
- When an item is discovered:
- The item is inventoried
- A data model is created for the item
- The model is mapped to the network topology showing the relationship between other items
- Once this is complete, Spectrum begins to monitor the item for faults
- To monitor the same inventory of items for performance, using the integration with DX NetOps Performance Management, the inventory is pushed from Spectrum OneClick to DX NetOps Portal, and then from Portal to Performance Management.
- Using the Spectrum OneClick inventory as a seed list, Performance Management adds each item from the OneClick inventory to the Performance Management inventory, which is viewed in DX NetOps Portal
- When the item is added to the inventory:
- The network item is assigned the performance metrics that are used to determine the specific data points to collect for the item
- A monitoring cadence for the item is established
- A context page is created containing all the performance metrics collected for the item, which is viewed in DX NetOps Portal
- Once this process is completed, Performance Management begins to monitor the performance of the item
- When new items are added to the network, they are typically automatically discovered and run through this process
|
Note: As a part of the integration between systems, Spectrum OneClick pushes faults to DX NetOps Portal. |
Watch the following video to learn how to run a new discovery configuration in DX NetOps Spectrum OneClick to discover and model network items for fault monitoring:
Watch the following video to learn how to create and run a discovery profile in DX NetOps Portal and determine the metrics for the discovered items:
Watch the following video to learn how to verify the status of new devices in DX NetOps Portal:For more information on discovery and monitoring configuration, refer to the following online courses:
- DX NetOps 24.3.x: Discover and Model Networks for Fault Monitoring
- DX NetOps 24.3.x: Discover Devices for Performance Monitoring
- DX NetOps 24.3.x: Configure Device Monitoring for Performance Monitoring
3. Configure SD-WAN Monitoring
To monitor the network items on the SD-WAN, DX NetOps Virtual Network Assurance (VNA) utilizes vendor-specific plug-ins to connect to the SD-WAN controller to collect the SD-WAN inventory, SLAs, and performance data. The plug-ins can be configured using the VNA API, or DX NetOps Portal.
| Note: Technically, the SD-WAN is not discovered as the inventory is supplied by the controller, but this inventory is pushed to Spectrum and Performance Management where it is run through their discovery and inventory processes. |
The following is an example of a typical workflow for configuring a VNA plug-in using DX NetOps Portal:
- A plug-in is created using a template for the appropriate SD-WAN vendor
- The template is filled out with the live environment information used by VNA to connect to the SD-WAN controller
- When the plug-in is saved, VNA begins to collect the SD-WAN network item inventory and performance data from the controller
- The data is pushed to Performance Management and Spectrum systems where the SD-WAN items are passed through the discovery processes for each system in order to add the items to the inventories and monitor the items for performance and faults
Watch the following video to learn how to configure a VNA plug-in to connect to a controller in order to inventory and monitor the SD-WAN:
Watch the following videos to verify VNA data integration with DX NetOps Spectrum OneClick:
Watch the following video to learn how to verify DX NetOps Virtual Network Assurance data integration with DX NetOps Portal to confirm VNA plug-in data is populating dashboards as required.
For more information on DX NetOps Virtual Network Assurance plug-in configuration, refer to the online course: DX NetOps 24.3.x: Configure Virtual Network Assurance Plug-Ins.
4. Configure NetOps Flow to Collect Flow Data from Devices
NetOps Flow monitors traffic flow on the managed side of the network by collecting flow data from devices. In order to collect the flow data:
- In DX NetOps Portal, verify the devices that will provide flow data are in the DX NetOps Portal inventory.
- Configure the devices to send flow data to the NetOps Flow collectors using the Internet Protocol Flow Information Export (IPFIX), NetFlow by Cisco, of sFlow formats.
To learn more about configuring NetOps Flow to capture traffic flow data and view the data in DX NetOps Portal, refer to the following resources:
- Online course: DX NetOps 24.3.x: Install and Configure NetOps Flow
- Documentation: NetOps Flow
5. Configure AppNeta Performance Monitoring
Configuring AppNeta involves deploying and configuring Monitoring Points (physical and virtual) on strategic locations on the network to actively and passively monitor the managed and unmanaged sides of the network. The Monitoring Points are used to generate synthetic traffic for active monitoring of the network and cloud applications, and monitor passive (live) traffic on the network. The data from Monitoring Points is captured by AppNeta, displayed in dashboards in the AppNeta UI, and the data is also shared with DX NetOps Portal where it is integrated with other performance data from other sources for end-to-end network monitoring in DX NetOps Portal.
The following is a summary of the AppNeta configuration process. For details and instructions on this process, refer to the learning path: Assure Network Quality with End-to-End Path Analytics.
AppNeta Configuration Summary
- Create an AppNeta monitoring plan to define clear, simple rules for what to monitor and from where
- Deploy AppNeta Monitoring Points at the locations determined for cloud connectivity monitoring
- Deploy AppNeta Monitoring Points within the cloud environments under the control of the network operations team
- Deploy physical or virtual Monitoring Points at the locations determined to identify which applications are running on the network
- Create monitoring policies to configure underlay and overlay monitoring
- Create web app groups to actively monitor layer 7 web application performance
- Optionally set up deep packet inspection for application identification and visibility in AppNeta
- Customize alert profiles in AppNeta to align with SLAs
- Configure a dashboard in AppNeta to summarize network performance for cloud targets from relevant locations
6. Validate Discovery and Metrics
After the network items from the WAN and SD-WAN have run through the discovery process, validate the DX NetOps Portal inventory is correct, the correct performance metrics are being collected, and the traffic flow data is being collected.
6a. Validate the Inventory
To validate the DX NetOps Portal inventory, DX NetOps Portal provides default inventory dashboards.
The inventory dashboards are accessible by administrators under Inventory > Items, where a variety of inventory dashboards are listed.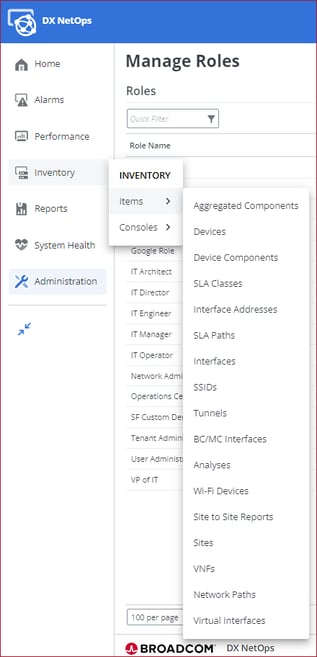
Figure 18: Example of navigating to the Inventory menu.
The dashboards organize the inventory into logical categories. Use these dashboards to validate the inventory is populated as expected.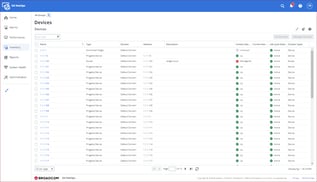
Figure 19: Example of the Devices inventory page listing all the devices in the DX NetOps Portal inventory.
Use the quick filter on an inventory table to limit the dashboard to specific items.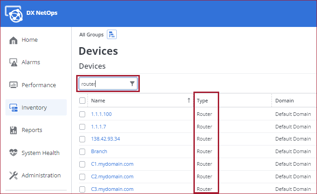
Figure 20: Example of using the Quick Filter to only display routers in the Devices table.
For more information on viewing the inventory, refer to the documentation page: Inventory Pages and Views
6b. Validate the Performance Metrics
To validate the required performance metrics are being collected, on an inventory dashboard, click on the name of a network item.
This opens the context page for the item. The context page organizes all the metrics collected for the item into tabs. Select the different tabs to view the metrics and validate the metrics are being collected as expected.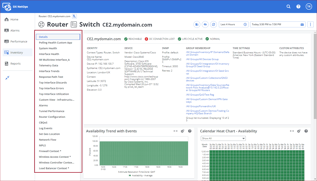
Figure 21: Example of a context page showing the metrics collected for a router. The metrics are organized into tabs, which are accessible in the left navigation.
Watch the following video to learn more about context pages:
For more information on viewing performance metrics, refer to the following resources:
- Documentation
- Online course
6c. Validate the NetOps Flow Data
To validate the traffic flow data is being collected from NetOps Flow, navigate to a default flow dashboard located under Performance > Flow.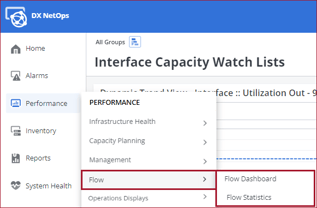
Figure 22: Example of navigating to the Flow menu to access the Flow Dashboard.
Using the flow dashboards, validate NetOps Flow data is integrated as expected.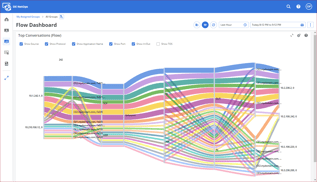
Figure 23: Example of a flow dashboard.
To learn more about how to validate and view NetOps Flow data in DX NetOps Portal, refer to the documentation topic: NetOps Flow.
7. Organize Data with Groups
Groups are a feature in DX NetOps Portal used to organize network items into logical categories and set the data context for dashboards. Using groups, a dashboard can show data from different sets of network items by simply changing the group that sets the data context for the dashboard.
DX NetOps Portal installs with default groups, such as the All Devices group. The default groups ensure that everything in the inventory is in at least one group. From there, groups are created by administrators to organize the network items as it makes sense for the monitoring requirements of the organization.
There are two types of groups administrators can create:
- Custom groups to organize similar items such as edge routers and interfaces
- Site groups to organize network items by geographic locations such as all tunnels, routers, and interfaces associated with a specific geographic location
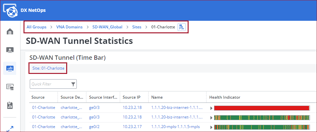
Figure 24: Example of a dashboard with the group data context set to 01-Charlotte so only data from the 01-Charlotte site groups displays on the dashboard.
Watch the following video to learn how to logically organize network items in DX NetOps Portal by creating and managing groups, and use groups as data set filters for dashboards, views, and context pages:
For more information on managing groups, refer to the online course: DX NetOps 24.3.x: Configure Groups for DX NetOps Portal
8. Create Business Hours Filters
Business Hours Filters are created by DX NetOps Portal administrators and typically define hours in a day when network activity is at its highest, and when network health is the most critical. When a business hours filter is applied to a group, a view, or a dashboard, the data is filtered to only the hours defined in the business hour filter. Filtering by business hours can help remove non-critical data from analytics that may skew the data, and focus the data on critical hours only. Filtering in this way is helpful when troubleshooting or looking for ways to optimize the network.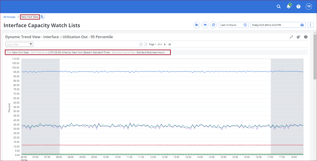
Figure 25: Example of a dashboard with the data context set to the New York Sites group, which has the Standard Business Hours filter applied to it. The filter is then automatically applied to the applicable views in the dashboard. Data from outside the business hours is grayed out.
For more information on configuring business hours filters, refer to the documentation page: Configure Business Hours Filtering.
For examples of business hours as they apply to views and dashboards, refer to the topic, Filter Data by Business Hours, in the online course: DX NetOps 24.3.x: Getting Started with DX NetOps Portal
9. Configure Alarms
Critical network events can be converted to alarms which can immediately notify network operations teams of the issue, provide information on the impact of the issue, and provide potential ways to resolve the issue.
The criteria for alarms is configured using:
- Threshold profiles in DX NetOps Portal
- Alarm noise suppression in DX NetOps Spectrum OneClick
- Alert profiles in AppNeta
9a. Create Threshold Profiles in DX NetOps Portal
Threshold profiles generate events and alarms for performance deviations based on performance deviation policies. Threshold profiles are created by administrators in DX NetOps Portal and the performance deviation criteria can be applied to any data integrated with DX NetOps Portal, such as NetOps Flow or AppNeta.
Watch the following video to learn how to create a threshold profile in DX NetOps Portal to generate threshold violation events and alarms based on deviations from baseline performance criteria:
Watch the following video to learn how to set up notifications for threshold violation events in DX NetOps Portal to notify teams when threshold violation events occur or change.
For more information on creating threshold profiles and notifications, refer to the online course: DX NetOps 24.3.x: Configure Performance Thresholds and Notifications
9b. Configure Alarm Noise Suppression in DX NetOps Spectrum OneClick
Alarm noise suppression in OneClick configures the consolidation of specific events and alarms into a single event or alarm in order to reduce the noise of multiple instances of similar network activity into a single event or alarm. Alarm noise suppression is configured by administrators in DX NetOps Spectrum OneClick. When an alarm is triggered in OneClick, the alarm is pushed to DX NetOps Portal as well where it displays in an alarms view.
Watch the following video to learn how DX NetOps Spectrum uses device criticality and identifies root cause of outages to implement downstream fault suppression isolation and calculate alarm impact.
Watch the following video to learn how to configure alarm notification policies for the Spectrum Alarm Notification Manager (SANM) to create policies and filters for alarm notifications:
For more information on configuring alarms in DX NetOps Spectrum OneClick, refer to the following resources:
- Documentation: Fault Isolation
- Online course: DX NetOps 24.3.x: Fault Isolation and Alarm Notification for Spectrum
9c. Configure Alert Profiles in AppNeta
Alert profiles in AppNeta are events that indicate unacceptable performance criteria, such as unacceptable data loss on a network path. Administrators create alert profiles in AppNeta based on a variety of network path, web path, and Usage metrics so that when AppNeta detects a violation of an alert profile condition, the system logs an event. Alert profiles are applied to paths and alerts are triggered when a monitored metric falls outside the desired threshold. Alerts triggered in AppNeta are also sent to DX NetOps Portal where the alerts display in Alarms dashboards.
|
Note: While alerts in AppNeta can be integrated with DX NetOps Portal, it is recommended to create baseline threshold profiles in DX NetOps Portal off of AppNeta data instead. However, even when utilizing performance thresholds in DX NetOps Portal, it is still important to fine tune AppNeta network path alert profiles to control which conditions should trigger automatic network diagnostic tests performed by Monitoring Points. |
For more information on configuring alerts in AppNeta, refer to the documentation page: Alerts and Notifications – Best Practices.
10. Create Dashboards and Views
Data is displayed in DX NetOps Portal in views on dashboards. The dashboards are a collection of different views which display the data in table and chart formats such as aggregated summaries, hourly rollups, and averages.
DX NetOps Portal provides a set of default dashboards and views which can be customized by administrators. Administrators can also create new, custom dashboards with custom views on the dashboards in order to organize critical network information into easy to read, at-a-glance formats that reflect the monitoring requirements of the organization.
Watch the following video to learn how to customize DX NetOps Portal dashboards with views and context pages to display meaningful information and visualizations for specific network monitoring requirements:
Watch the following video to learn how to drill down from a dashboard in the DX NetOps Portal into context pages, as well as how to configure context pages to display meaningful views, including information about device components and interfaces:
For more information on creating dashboards and views, refer to the following resources:
- Documentation: Dashboards
- Online course: DX NetOps 24.3.x: Performance Dashboards and Reports
11. Configure Alarm Dashboards
In DX NetOps Portal, administrators can create custom dashboards with Alarm views to monitor specific network performance alarms generated from threshold profiles in DX NetOps Portal, faults from DX NetOps Spectrum OneClick, and alerts from AppNeta.
For more information on using the Alarms view, refer to the documentation page: Alarms View
12. Configure User Roles
In DX NetOps Portal, all users are assigned a role in the system. The assigned role determines the permissions for the user such as the dashboards the user can view, the groups the user has access to, if the user can export reports, and if the user can perform admin functions such as create new groups and dashboards.
The goal of creating a role is to limit those users to only the dashboards and functionality they need to perform their network monitoring role in order to streamline workflows so users only see what they need, and are not overwhelmed with unnecessary information.
For example, a level 1 operator may only need basic view-only access to dashboards, while a level 2 operator may need advanced rights to drill down into data, see capacity dashboards, and create groups and dashboards. Roles would be created for each NOC level with the appropriate permissions, and the users assigned to the roles.
Watch the following video to learn how to configure the settings for user roles to determine the menu rights, DX NetOps Portal functionality rights, and data source rights for users assigned to that specific role:
Watch the following video to learn how to create a user in the DX NetOps Portal by assigning a role, defining access permissions, assigning groups, defining group administration rights, and defining product privileges. Then, once a user is configured, proxy the user, viewing the DX NetOps Portal with their permissions to confirm the user is configured properly.
For more information on creating and managing roles, refer to the following resources:
- Documentation: Manage Roles and User Accounts
- Online course: DX NetOps 24.3.x: Administer Users for Performance Management
13. Configure Reports
In DX NetOps Portal, dashboards and views can be exported as reports, and emailed on a regular schedule, such as "Good Morning" reports for operations leads to get a network health summary each morning.
In addition to generating reports from dashboards and views, custom reports can be run and distributed on a schedule as well.
Watch the following video to learn how to generate digital and printed reports from the content of dashboards and context pages in DX NetOps Portal:
For more information on reporting in DX NetOps Portal, refer to the following resources:
- Documentation: NetOps Business Reports
- Online course: DX NetOps 24.3.x: Performance Dashboards and Reports
The following is an example of how using DX NetOps Portal can help to quickly identify an issue on the network before there is an outage, and then how to drill down into the details of the issue for issue investigation.
Site and Tunnel Performance
In DX NetOps Portal, the SD-WAN Tunnel Statistics dashboard can quickly help to identify problem sites and tunnels, and the time frames when the issues are happening.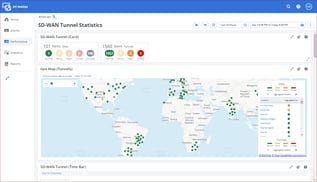
Figure 26: Example of the SD-WAN Tunnel Statistics dashboard displaying SD-WAN data for sites located around the globe.
On the SD-WAN Tunnel Statistics dashboard, the SD-WAN Tunnel (Card) view shows a quick overview of the health of all the sites and tunnels.
Figure 27: Example of the SD-WAN Tunnel (Card) view.
The Geo Map (Tunnels) view provides a topology view of all the sites and tunnels with color-coding for quick visual cues to performance.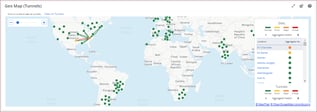
Figure 28: Example of the Geo Map (Tunnels) view with the Charlotte site selected, and the tunnels displayed.
And the SD-WAN Tunnels (Time Bar) view shows the different statuses of tunnel performance over a specific time range.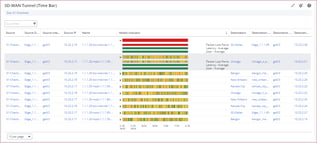
Figure 29: Example of the SD-WAN Tunnel (Time Bar) view where the time bar is broken into segments where color codes represent the health during different time frames. The bar can be expanded to show packet loss, latency, and jitter for the tunnel.
These views, and the other views on the dashboard all provide different insights into the SD-WAN performance and can be used for troubleshooting.
|
Note: One comment about the Major/Orange and Critical/Red statues: These statuses do not mean something has necessarily gone wrong, but are indicators that something should be investigated. This is especially true for a Critical/Red status. The Critical/Red means there may not be an outage happening yet, but you should investigate this immediately to avoid the outage that will most likely happen soon. |
Also, changing the time range for the dashboard data can filter the entire dashboard so only data from the problematic time range is displayed.![]()
Figure 30: Example of using the time frame selection at the top of each dashboard to define the time range for the data on the dashboard.
Application Performance
To troubleshoot application performance, in DX NetOps Portal, the SD-WAN Application Statistics dashboard can quickly help to identify application performance issues, and the time frames when the issues are happening.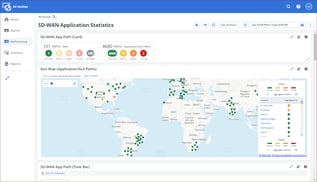
Figure 31: Example of the SD-WAN Application Statistics dashboard.
The views on the SD-WAN Application Statistics dashboard are similar to the SD-WAN Tunnel Statistics dashboard views, but the views are configured with the SLA thresholds as the performance baseline.
Using the different views on the dashboard, you can quickly see if there are any SLA violation events on the tunnels.
The SLA violations can help operators understand the nature and extent of the violation with a description, what tunnel the violation is associated with, and the time when the violation happened.
One key difference when it comes to checking the tunnel health for application transports is in the SD-WAN App Path (Time Bar) view, which provides insight into the SD-WAN tunnels, is there will be multiple instances of each tunnel based on the number of SLAs so that each SLA can be tracked across every tunnel.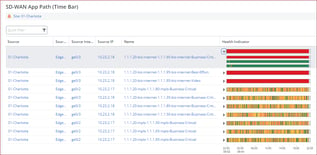
Figure 32: Example of the SD-WAN App Path (Time Bar) view which displays the performance of applications based on their SLAs, such as Best Effort, Business Critical, and Video.
As an example of how this works, if there are three SLAs in the inventory, there will be three different application paths displayed in the table: one path representing the performance of the path for each SLA.
So if there are three SLAs such as Best Effort, Business Critical, and Video, the view displays the application path three different times, one for each SLA class. This way you can validate each SLA is being met across every potential path.
The view also provides details for packet loss, jitter, and latency for each path. To view these details, in the Health Indicator column, click the arrow next to the time bar to expand the path to display the performance status for packet loss, jitter, and latency.
Figure 33: Example of expanding a time bar to show packet loss, latency, and jitter.
Investigating Performance Issues
Checking on these metrics can help identify trends and patterns that may have started a performance issue, and also provide insight into how the issue evolved.
For example, the SD-WAN Tunnel (Time Bar) view displays the source and destination interfaces associated with the tunnel.
These interfaces are linked in the table, and clicking an interface opens the context page for the interface.
Figure 34: Example of investigating a performance issue using the SD-WAN Tunnel (Time Bar) view, and in the Source Interface column, clicking the ge0/3 interface to open the context page for more detailed issue investigation.
The Health tab on the interface context page can be explored to uncover any issues with the interface.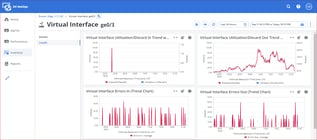
Figure 35: Example of the ge0/3 interface context page with the Health tab selected showing that the interface is experiencing discards, which are most likely the cause of the packet loss and performance degradation.
For example, a high rate of interface discards can result in packet loss on the tunnel.
Using the interface discard data as a starting point, the issue can be investigated further and resolved.
The Network Observability by Broadcom solution tames the complexity of software-defined WANs and hybrid networks with simplified workflows; multi-vendor monitoring; multi-edge monitoring; easy to read dashboards configured with the performance baselines from the organization; alerts when critical issues arise; and providing full-stack, end-to-end coverage of the network for issue resolution and optimization, all within the single DX NetOps Portal UI.
Schedule a demo to see exactly how Network Observability by Broadcom can help tame the complexity of software-defined WANs and hybrid networks.
For technical documentation for Network Observability, refer to the DX NetOps and AppNeta online documentation.
For a complete list of upcoming and on-demand presentations in the Network Observability by Broadcom series, visit the Small Bytes page.
For more information on how to implement Network Observability by Broadcom for other use cases, explore other learning paths.
