|
Key Takeaways
|
|
ValueOps Insights is an innovative software solution that revolutionizes how organizations capture, aggregate, and utilize data across their value streams. The solution’s dashboards present normalized data aggregated from all of the diverse tools operating in the organization, from across teams and value streams. This ensures that each report and decision can draw from complete, real-time data. By effectively bridging the data gap and harmonizing critical information from across all organizational silos, ValueOps Insights empowers decision-makers with comprehensive insights so they can make intelligent decisions.
This article delves into the capabilities and benefits of the out-of-the-box, role-based dashboards ValueOps Insights provides, revealing how they give decision-makers the visibility they need to understand and improve their business.
Engineering and Agile Management
The Engineering and Agile Management dashboard provides a comprehensive overview of project status, task progress, resource allocation, timelines, issues, and team collaboration metrics, regardless of the tools teams are using. This dashboard helps users identify bottlenecks and manage projects efficiently and effectively, so projects stay on track and reach successful completion. Here are some important elements that the Engineering and Agile Management dashboard presents:
- Project overview: Provides a high-level view of ongoing projects, their status, key milestones, and overall progress. This allows stakeholders to quickly grasp the status of various initiatives.
- Task allocation and progress: Showcases tasks assigned to team members, their completion status, and any pending or overdue tasks. This helps in monitoring individual and team productivity.
- Resource utilization: Displays resource allocation and workload distribution across teams or departments. This aids in identifying resource bottlenecks or areas with excess capacity.
- Timeline and deadlines: The dashboard may include timelines or Gantt charts displaying project timelines, deadlines, and critical paths. This helps in tracking deadlines and managing project schedules.
- Issue tracking: Highlights any issues, blockers, or risks associated with projects. This could include unresolved issues, risks impacting the project, or dependencies causing delays.
- Performance metrics: Shows key performance indicators (KPIs), such as project cycle time, throughput, or velocity. These metrics offer insights into project efficiency and performance.
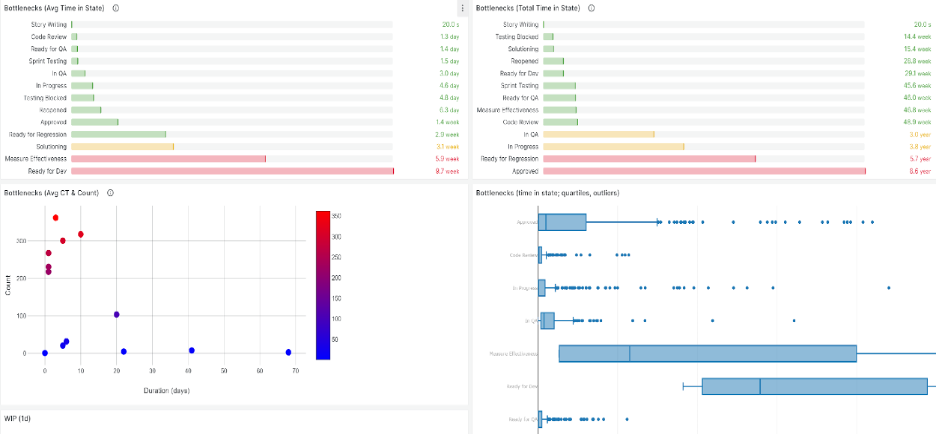
Figure 1: View bottlenecks across teams.
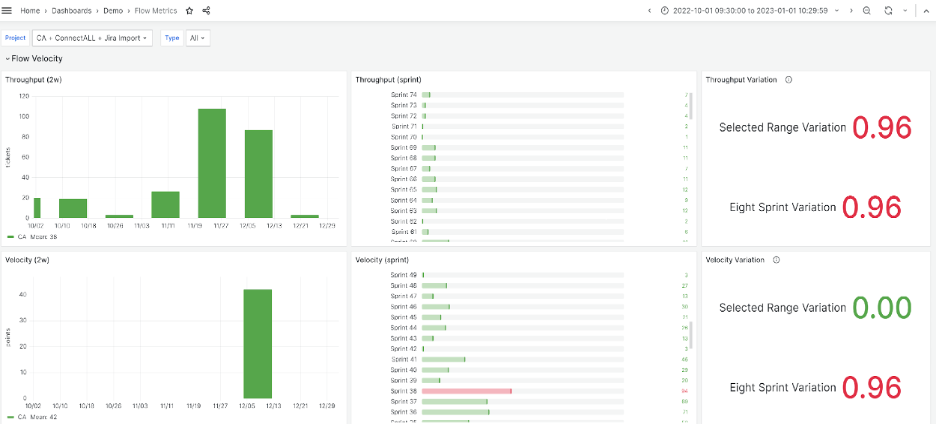
Figure 2: Flow metrics across teams.
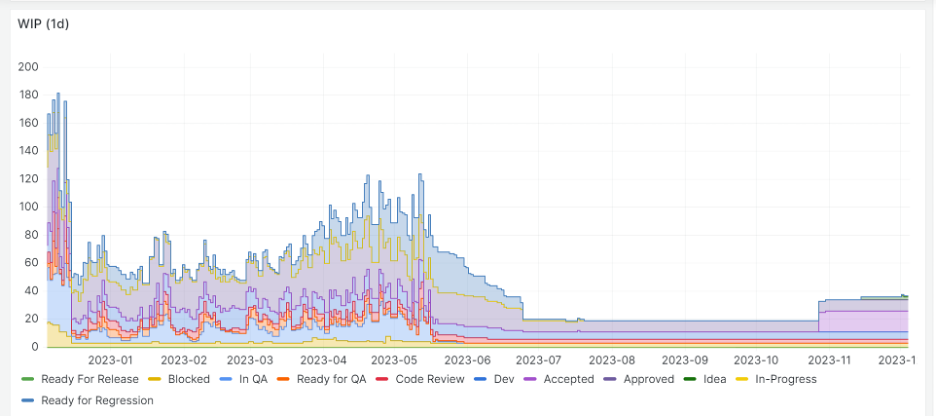
Figure 3: Chart depicts work in progress (WIP) across teams and value streams.
Product Portfolio Management
The Product Portfolio Management dashboard enables decision-makers to have a consolidated and data-driven view of the organization's project portfolio. This visibility facilitates strategic decision-making by providing insights into project status, resource allocation, financial details, risks, and alignment with business objectives. Here are key elements this dashboard features:
- Project portfolio overview: Offers a high-level view of all projects within the portfolio, including their status, timelines, and resource allocation. This enables decision-makers to grasp the overall health and progress of the portfolio.
- Resource allocation and capacity planning: Displays resource allocation across various projects and departments, indicating if resources are overutilized or underutilized. This helps decision-makers optimize resource allocation and improve capacity planning.
- Financial metrics: Includes financial data, such as budget vs. actual spending, cost variance, return on investment (ROI), and project profitability. This information is crucial for decision-makers to assess the financial health and viability of projects.
- Risk assessment and mitigation: Highlights any potential risks associated with projects, their impact, and mitigation strategies. Decision-makers can prioritize risk management efforts based on identified risks.
- Strategic alignment: Shows how projects align with the organization's strategic goals and objectives. Decision-makers can ensure that the portfolio is aligned with the overall business strategy.
- Product development lifecycle: Offers a comprehensive view of product development stages, from ideation to launch and post-launch phases. Tracks progress, milestones, and the status of feature development, enabling decision-makers to monitor the product's advancement.
- Customer feedback and satisfaction: Integrates customer feedback, satisfaction metrics, and support ticket data, providing insights into user sentiments and experiences. Decision-makers can assess customer satisfaction levels, identify pain points, and prioritize the improvements that are crucial for enhancing user experience.
- Strategic roadmap alignment: Aligns product initiatives with the broader business strategy. Illustrates how each product feature or enhancement contributes to overarching organizational goals, helping decision-makers ensure alignment and prioritize projects that are closely aligned with strategic objectives.
- Project prioritization: Aids in ranking or prioritizing projects based on their importance, impact, or strategic value. Leaders can make informed decisions about project priorities within the portfolio.
- Performance metrics: The dashboard may include KPIs related to project performance, such as success rates, on-time delivery, and quality metrics. This helps in assessing project performance and identifying areas for improvement.
- Portfolio health indicators: Provides summary indicators or color-coded visuals to indicate the health of projects or the overall portfolio, enabling decision-makers to quickly identify troubled areas.
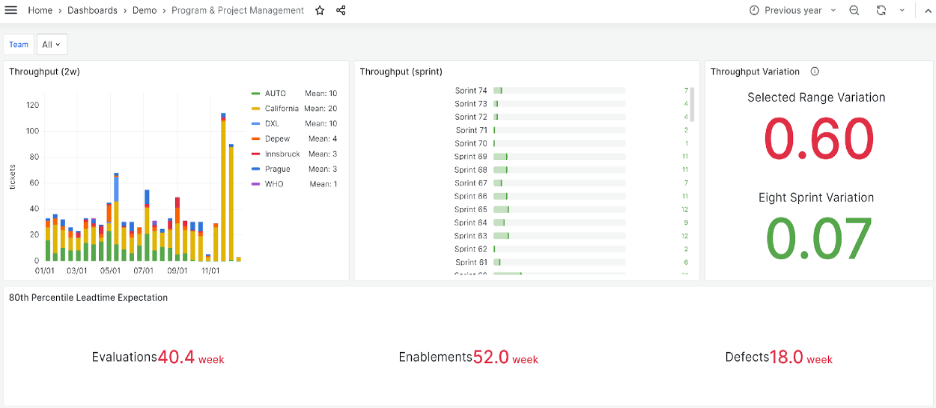
Figure 4: Throughput metrics help decision-makers to see the volume of work completed across teams or value streams.
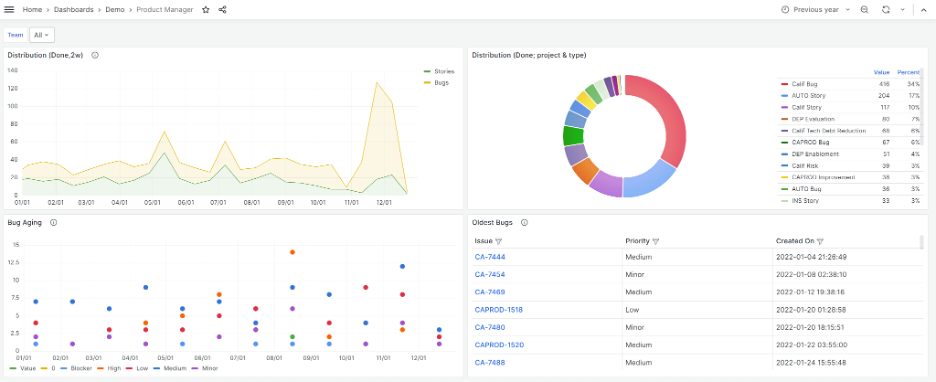
Figure 5: Charts enable viewers to get a close look at defects in development across value streams.
IT Service Management (ITSM)
The ITSM dashboard equips decision-makers with actionable insights to optimize IT service delivery, mitigate risks, and improve operational efficiency. These insights help leaders enhance overall IT performance, in alignment with organizational goals and customer expectations. Here are some key elements that the dashboard features:
- Service performance and availability: Showcases real-time data on service availability, uptime, downtime incidents, and response times. Decision-makers can swiftly assess the health of IT services and identify areas needing immediate attention to ensure uninterrupted operations.
- Incident and problem management: Includes metrics related to incident volumes, response times, and resolutions. Decision-makers can track the efficiency of incident management processes, identify recurring issues, and allocate resources for effective problem resolution.
- Change and release management: Displays metrics on changes implemented, success rates, and impact analysis. This aids decision-makers in assessing the effectiveness of change management processes and minimizing disruptions caused by releases.
- Service desk metrics: Offers data on ticket volumes, response times, resolution rates, and customer satisfaction scores, providing insights into service desk performance. Decision-makers can gauge the efficiency of service desk operations and make improvements to enhance customer satisfaction.
- Asset and configuration management: Presents data related to asset utilization, configuration changes, and compliance. Helps decision-makers ensure effective asset management, maintain compliance, and optimize asset utilization.
- SLA compliance: Displays adherence with service-level agreements (SLA) and performance against agreed-upon benchmarks. Decision-makers can evaluate performance in meeting SLAs and take corrective actions if necessary.
- Security and compliance: Offers views that incorporate security incident data, compliance metrics, and vulnerability assessment results, enabling users to assess IT security posture and compliance adherence. With these insights, decision-makers can more effectively prioritize security initiatives and ensure regulatory compliance.
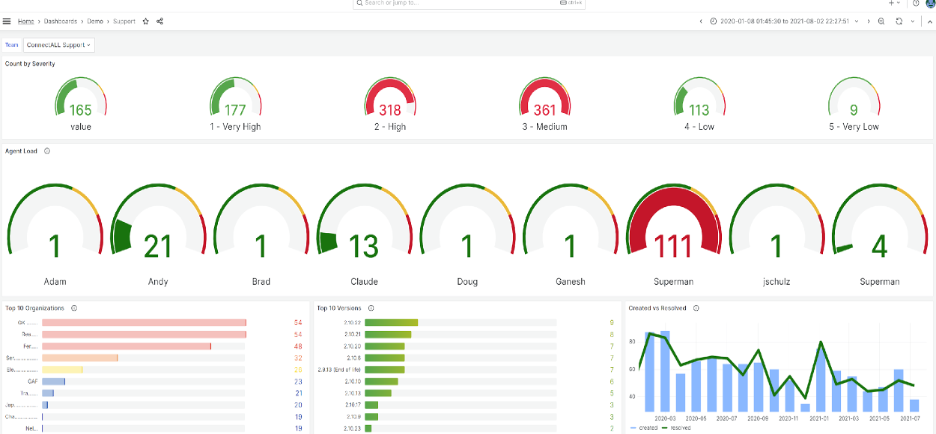
Figure 6: Severity and agent load across value streams.
DevOps
The DevOps dashboard provides a comprehensive overview of the software delivery pipeline across teams and value streams. This dashboard enables leaders to do quick assessments of development, deployment, and operational aspects, supporting data-driven decisions and improvements in the DevOps process. By aggregating data from all teams across value streams, the dashboard enhances collaboration between development and operations groups. The ValueOps Insights dashboard for DevOps includes the highlights below and much more:
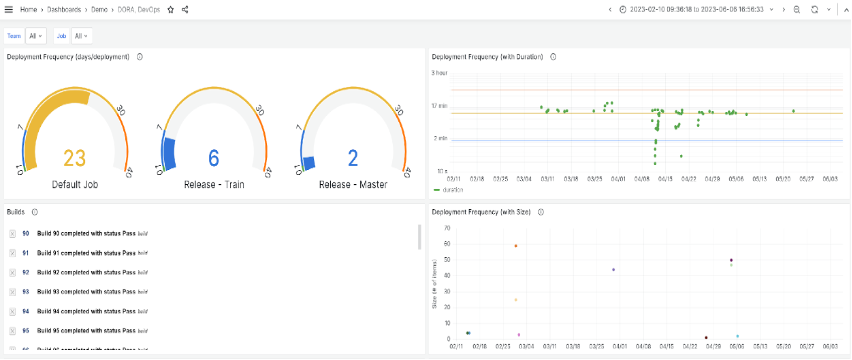
- Deployment frequency: Displays information on how frequently new code is being deployed to production. This helps users understand the pace of development and release cycles.
- Lead time: Depicts the time taken from code commit to deployment. This metric conveys the efficiency of the development process.
- Change failure rate: Reveals the percentage of unsuccessful or problematic deployments. This gives viewers an idea of the stability and reliability of the released code.
- Mean time to recovery (MTTR): Shows how long it takes to recover from failures or incidents. This metric reflects the team's ability to promptly identify and resolve issues.
- Infrastructure and application monitoring: Delivers real-time data on system health, performance metrics, error rates, and other relevant KPIs.
- Testing metrics: Offers insights into test coverage, test success rates, and any critical issues found during testing.
- Code quality: Displays metrics related to code quality, such as code reviews conducted, code coverage, and static code analysis results.
- Resource utilization: Provides information on resource allocation and utilization across different environments (such as development, staging, and production), helping decision-makers to optimize efficiency.
Flow Metrics
The Flow Metrics dashboard provides critical insights into the efficiency and efficacy of workflows within an organization. Here are the elements that hold top importance for decision-makers:
- Cycle time analysis: Tracks the time taken for a task or project to move from initiation to completion. Decision-makers can use this visibility to identify bottlenecks, streamline workflows, reduce cycle times, and improve efficiency.
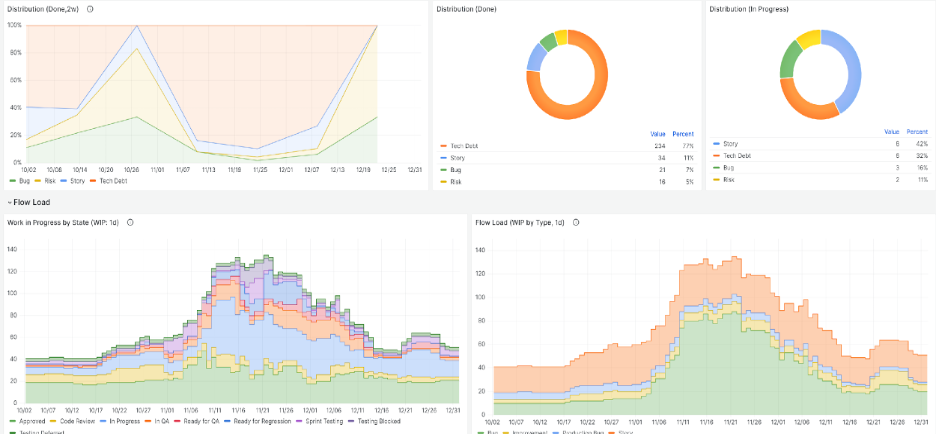
- Throughput and work in progress (WIP): Presents metrics surrounding throughput (the rate of completed work items) and WIP, which are crucial indicators of productivity and workload management. Decision-makers can leverage these metrics to balance workloads and optimize resource allocation.
- Flow efficiency: Measures the time that work items are in an active status, versus experiencing wait times or delays. Decision-makers can analyze this metric to identify inefficiencies and optimize processes, thereby enhancing overall flow efficiency.
- Blocker analysis: Enables identification of frequent blockers or impediments, providing decision-makers with insights to address underlying issues. Resolving recurrent blockers contributes to smoother workflows and faster delivery.
- Lead time distribution: This metric displays the distribution of lead times, depicting the time it takes to go from the initial request for a work item to its completion. Decision-makers use this insight to understand variability in task completion, which can help them more accurately predict delivery times.
- Process bottlenecks: Highlights areas or stages in which work items accumulate or encounter delays, offering actionable insights that enable decision-makers to eliminate bottlenecks and streamline workflows.
- Quality metrics: Incorporates quality indicators, such as defect rates or rework ratios, within flow metrics. Decision-makers can monitor these metrics to gain insights for optimizing efficiency, speeding delivery, and maintaining high quality standards.
This Flow Metrics dashboard equips decision-makers with actionable insights to enhance workflow efficiency, reduce cycle times, identify and resolve bottlenecks, and maintain a balance between speed and quality. In the process, they can foster a more agile and productive work environment.
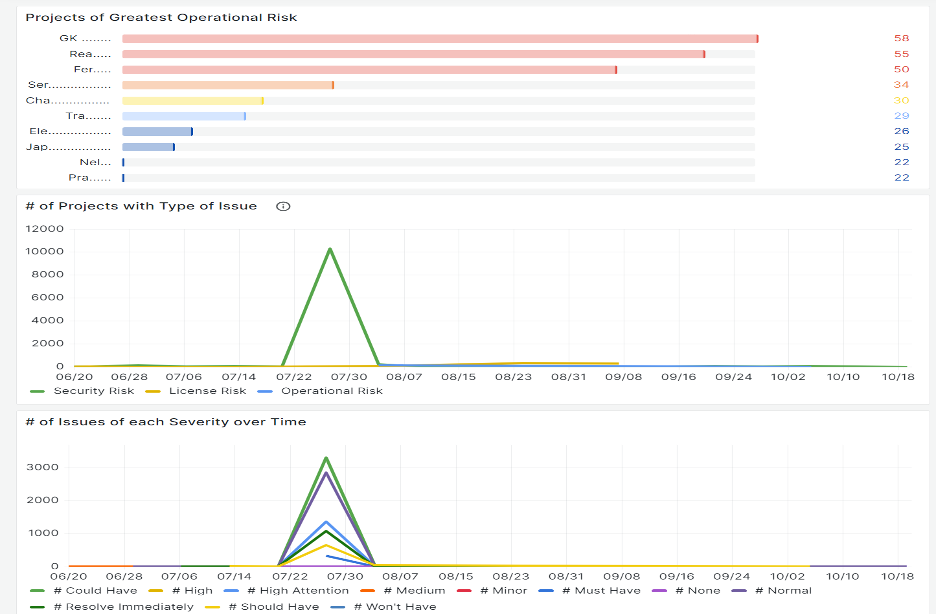
Security Metrics
The Security Metrics dashboard equips decision-makers with actionable insights to assess security risks, prioritize mitigation efforts, ensure compliance, and strengthen the organization's overall security posture. The dashboard includes these elements:
- Vulnerability assessment results: Displays data on identified vulnerabilities, severity levels, and their status (open/closed). This allows decision-makers to understand the organization's exposure to potential threats and prioritize vulnerabilities based on severity, which aids in efficient risk mitigation.
- Incident response and resolution: Presents metrics related to security incidents, response times, resolution rates, and incident trends, providing insights into the effectiveness of the incident response process. Decision-makers can evaluate the organization's ability to promptly detect, respond to, and resolve security incidents.
- Compliance adherence: Displays compliance metrics against industry standards, regulations, or internal policies, helping decision-makers ensure that the organization meets required security compliance benchmarks. This aids in avoiding legal implications and reputational risks.
- Security awareness and training: Features metrics indicating employee participation, completion rates, and effectiveness of security awareness programs, offering insights into the workforce's readiness to address security threats. Decision-makers can assess the impact of training initiatives on improving security practices.
- Risk management effectiveness: Displays risk assessments, risk levels, mitigation actions, and residual risks, helping decision-makers understand the organization's risk landscape. This visibility aids in prioritizing risk mitigation efforts and making more informed decisions on resource allocation.
- Security controls monitoring: Presents metrics on the performance and effectiveness of security controls, such as firewall rules, intrusion detection systems, and access controls. This enables decision-makers to evaluate their effectiveness in safeguarding against threats.
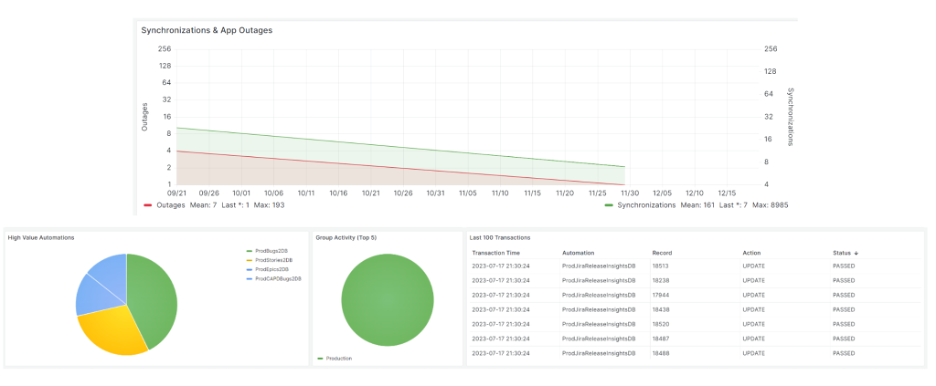
Automation
The Automation dashboard equips leaders with actionable insights to evaluate the effectiveness of automation initiatives, identify areas for improvement, and optimize processes. These insights can fuel strategic decision-making that promotes continued automation success.
Here are key elements for decision-makers:
- Automation coverage: Displays the extent of processes or tasks that have been automated versus those that remain manual, providing decision-makers with an overview of automation adoption. Understanding existing coverage helps in identifying areas ripe for further automation and assessing the impact of existing automation efforts.
- Error rates and exceptions: Presents metrics that showcase error rates, exceptions encountered, and their resolutions. This visibility helps decision-makers assess the reliability and effectiveness of automated processes. Monitoring these metrics aids in fine-tuning automation workflows for improved accuracy and reduced errors.
- Performance metrics: Provides data on the speed, throughput, and efficiency gains achieved through automation. This visibility offers insights into process optimization. Decision-makers can evaluate the benefits of automation in terms of time savings and productivity improvements.
- Cost savings and ROI: Demonstrates the cost savings and return on investment (ROI) achieved through automation initiatives, helping decision-makers assess their organization’s financial benefits. This helps leaders in justifying automation investments and making informed decisions about scaling or expanding automation efforts.
- Resource utilization: Presents metrics indicating resource allocation, workforce engagement in automation tasks, and efficiency gains. This visibility helps decision-makers acquire an improved understanding of resource distribution. With these insights, leaders can optimize resource utilization and more effectively align workforce skills with automation needs.
- Compliance and governance: Incorporates data on compliance adherence and governance practices within automated processes, helping decision-makers ensure that automation initiatives meet regulatory requirements and organizational policies.
- Success rates and adoption trends: Displays the success rates of automation projects and adoption trends among teams, providing insights into the acceptance and effectiveness of automation tools and workflows. Decision-makers can identify areas of success and opportunities for improvement.
- Impact on business objectives: Illustrates how automation aligns with, and affects, business objectives, such as improved customer experience or reduced time to market. This visibility helps decision-makers understand the strategic value of automation initiatives.
Conclusion
ValueOps Insights is a game-changer for data unification and actionable insights. Its suite of seven out-of-the-box dashboards provides holistic views and targeted insights across various domains. With these capabilities, ValueOps Insights fosters informed decision-making and helps organizations thrive in today's dynamic business landscape.
To learn more and book a one-on-one demo, be sure to visit the ValueOps ConnectALL and ValueOps Insights demo page.