
With Experience-Driven NetOps, it's now possible to have user experience, active testing, and network path analytics in the NOC for any managed or unmanaged network
We all know that cloud and SaaS adoption continues to grow rapidly, often outpacing budgets. In fact, spending on IaaS and SaaS exceeded budgets in more than 40% of organizations in 2021. As a result, network traffic is now spending much more time on the internet than in our own data centers. The internet has become the new enterprise network.
So if enterprises are heavily investing in these services and moving resources out of the data center, how do you actually ensure these services deliver on their full potential? How do you make sure these services heighten—not hinder—your ability to do in depth, end-to-end monitoring? How do you ensure that your NetOps teams and their monitoring tools work effectively in a cloud- and SaaS-first networked world?
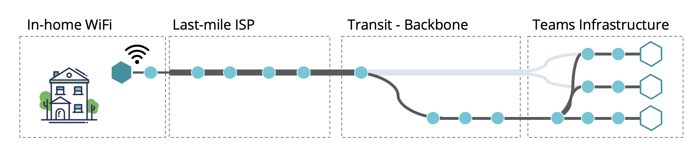
Figure 1: Cloud and SaaS adoption is creating a new enterprise network that network teams are now responsible for.
This latest release of DX NetOps, our award-winning network monitoring software, is transforming Network Operations Center (NOC) triage and response times. It brings user experience to the forefront of NOC visibility across traditional and SDx networks, on-premise or in the cloud, and across the WAN into ISP networks.
DX NetOps 22.2 extends your network monitoring visibility across the internet for a complete hop-by-hop picture of modern network delivery for the SaaS-based user experience, work from anywhere user experience, and hybrid-cloud user experience, along with active testing of modern network delivery before, during, and after deployments.
Most importantly, we are routing these user experience metrics through the NetOps standard operating procedures and workflows you have come to depend on. Backed by alarms, events, topology, performance, faults, flows, logs, configurations, and now user experience metrics from AppNeta, you yourself will still be able to triage easily, find root causes quickly, escalate to engineers or architects, open trouble tickets, or isolate and resolve network delivery issues impacting user experiences.
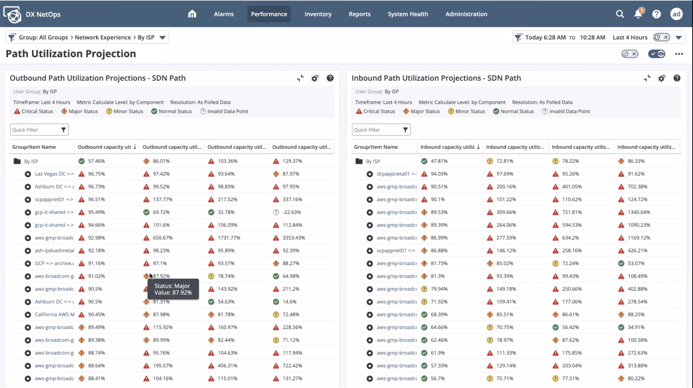
Figure 2: DX NetOps’ network path analytics visualizes critical ISP and cloud network change events and delivers pinpoint focus on what matters for fast isolation of user and service disruptions
By integrating AppNeta’s inventory, events, and performance metrics into DX NetOps, teams gain the ability to easily triage not only up/down issues, but also end-user experience issues across the entire path of network transactions. DX NetOps offers a seamless operational experience, industry best practices, and best-in-class triage and alarm correlation workflows. By leveraging these capabilities, teams can be equipped like never before to ensure resilient connectivity across all network types.
Download our white paper on Experience-Driven NetOps today to learn more.

Jeremy Rossbach
As the Chief Technical Evangelist for NetOps by Broadcom, Jeremy is passionate about meeting with customers to identify their IT operational challenges and produce solutions that fit their business and network transformation goals. Prior to joining Broadcom, he spent over 15+ years working in IT, across both public...
Other resources you might be interested in

AAI - Creating and Publishing AI-powered Data Insights
Learn how to create AI-powered data insights using natural language prompts, refine the generated results, and publish useful insights.
AAI - Configuring the Cost Model for Chargeback Reporting
Learn how to configure the Cost Model in AAI by defining cost centers, associating jobs with those cost centers, and entering annual cost factors.
Clarity: Strategic Workforce Planning with the Staffing Workspace
This course blends strategic portfolio management (SPM) concepts with Clarity Staffing. See how to use the product and make better business decisions.
Rally Office Hours: August 20, 2026
This Rally Office Hours session reveals the general availability of a Kanban board extension to the custom board widget. Get expert tips for custom views.
ValueOps ConnectALL 101
This is an introductory course for new ConnectALL administrators and implementation teams.
AAI: Monitoring Global Shift Operations with Jobstream Runs Views
Focuses on live operational triage, teaching operators to track real-time executions, identify "Red-Zone" failures, and drill down to resolve bottlenecks.
AAI: Triaging Incidents via the Gantt View
See how to use the Gantt Command Center to isolate failures and restore pipelines. Trace dependency paths, evaluate delays, and inspect job properties.
AAI: Tracking Trends & Runtimes with Jobstream Run Details
Learn how to analyze multi-week historical performance using Actual, Relative to SLA, and SLA Graph views. See how to spot and prove performance issues.
Rally Office Hours: August 13, 2026
This Rally Office Hours session covers upcoming product deprecations, custom view migrations, high-level reporting solutions, and workspace field updates.