|
Key Takeaways
|
|
DX NetOps 21.2 network monitoring software continues to innovate and improve the scale, speed, and simplicity of network operations with a focused set of high-value features and capabilities. Exciting new enhancements include increased monitoring scale, telemetry support, expanded SDN and cloud technology coverage, and usability and security updates.
Expanded SD-WAN Monitoring Capabilities for VMware SD-WAN by VeloCloud
Our Spectrum network monitoring software has also enabled fast and easy monitoring of VMware SD-WAN by VeloCloud. The latest release of the DX NetOps solution delivers the following key capabilities for monitoring and assuring your VMware VeloCloud deployments.
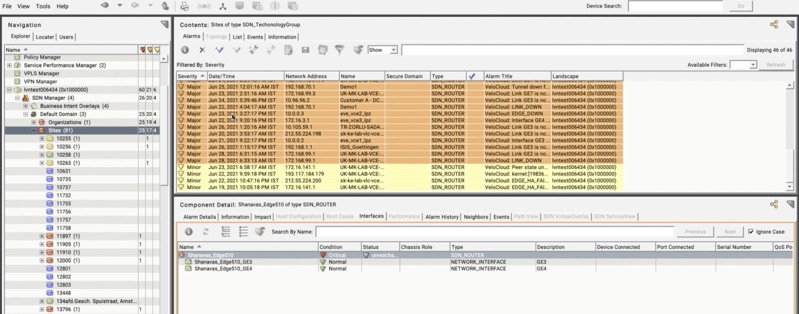
Figure 1: DX NetOps Spectrum provides full insights, site connectivity, policies and tunnel information along with events and alarms support to identify network outages and WAN issues.
Inventory
- Collects the following network components from the VeloCloud Orchestrator:
- Orchestrator, Enterprise Proxy, Enterprises, Gateway Pool, Gateways, Sites, Edges, Edge Interfaces, Edge Sub Interfaces, Links, Tunnels (Edge to Edge, Edge to Gateway), Policy Class, SLA Path, Alarms, and Events raised on Orchestrator and Edges
Alarms/Events
- Collects all the events from the VeloCloud orchestrator and forwards them to DX NetOps one-of-a-kind event correlation, fault isolation, and root cause analysis
Topology
- End-to-end visibility of how different sites are connected, including policies, tunnels information
Enhanced Network Fault Monitoring Capabilities for Cisco Meraki LAN and WiFi Technologies
The DX NetOps Spectrum solution has enhanced its monitoring capabilities for Cisco Meraki MS switch devices to provide end-to-end visibility across Cisco Meraki Appliances. In previous versions of this network monitoring software, the solution enabled you to monitor Meraki MR WiFi Access Point devices and Meraki MX Security and SD-WAN appliances. DX NetOps now can collect the following key components of Cisco Meraki switches for improved network operations visibility and resilience of your SD-WAN and WiFi deployments:

Figure 2: DX NetOps Spectrum now provides end-to-end visibility into Cisco MX, MR and MS device performance and availability.
Inventory
- Organization, Networks, MS Devices, Clients, Uplink Interfaces for MS Devices
Policies and Tunnels
- MS and MX device communication and performance
Event/Alarms
- Support for Meraki MS alarms via API and Syslog
- End-to-end visibility of Meraki MX, MR, and MS devices
Enhanced Network Monitoring Capabilities for Nokia Nuage Software-Defined Data Center (SDDC)
DX NetOps continues its innovation in SDx monitoring with coverage for Nokia Nuage SDDC deployments. The solution unifies fault and performance visibility while reducing alarm noise and delivering easy workflows that correlate the software-defined overlay with the underlay infrastructure for quick triage of this modern network technology.
The solution integrates with two Nuage components: Nuage Virtual Service Directory (VSD) to collect overlay information about the Nuage Fabric network and the Nuage Virtualized Service Assurance Platform (VSAP) to provide fault, performance, and inventory capabilities to deliver the following use cases:
- How Nuage Private Cloud and Nuage Fabric/Gateway network is configured
- Ability to discover and correlate physical network with virtual network
- Reduce alarm noise by showing only actionable alarms and provide effective root cause analysis
- Alarm suppression and correlation of re-route/path-change/link down alarms with performance-based events
- Correlate the software-defined overlay with the underlay infrastructure that are supporting network delivery policies
Support for Syslog Event Messaging to Improve Network Fault isolation
Syslog messages are an important source of potential network fault events. To continue improving operator visibility, DX NetOps Spectrum network monitoring software now supports ingestion of syslog messages to identify and isolate network faults. These syslog messages will be processed as relevant events and alarms and applied to the respective device model in the solution by using the open-source software ‘rsyslog’ with the ‘omsnmp’ plugin and modeling the rsyslog server as a SystemEdge host.
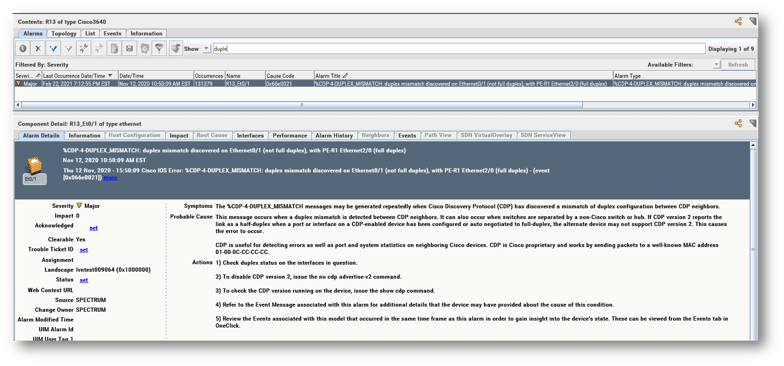
Figure 3: DX NetOps Spectrum supports syslog events and alarming to further improve network fault isolation.
Improved Network Configuration Management (NCM) with Detailed Reporting on Violation Details
DX NetOps Spectrum provides deep configuration management, change tracking, compliance auditing, and a device configuration repository to adhere to strict compliance regulations as well as to identify and resolve configuration changes that disrupt service. The solution is able to show NCM violation details like violated patterns, violated lines, missing lines, and the count through ad hoc reporting.
DX NetOps Spectrum has also enhanced the NCM multi-line block policy to display violated lines and missing lines in the ‘View Violation’ page of OneClick Console.
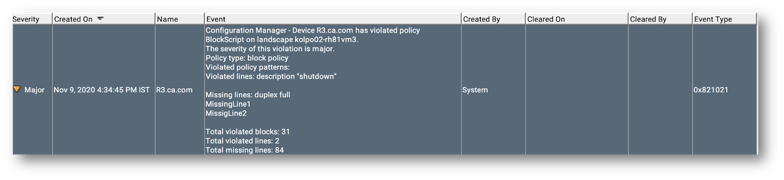
Figure 4: DX NetOps Spectrum can show NCM violation details like violated patterns, violated lines, missing lines and the count through ad hoc reporting.
Security Improvements and Enhancements
Broadcom is proud to continue providing our customers with a secure platform for network monitoring. The latest release of DX NetOps Spectrum delivers the option to enable security for all CORBA clients with upgraded Visibroker to 8.5sp7 which supports TLSv1.3 to secure all communications within this architecture.
Form-based authentication is introduced in this latest version which maintains session ID to authenticate the request from clients. Customers can now securely log off the sessions and the username and password are no longer stored in the browser.
DX NetOps Spectrum network monitoring software now supports multiple webapp sessions to view multiple network fault alarms without having to close previous sessions. To improve operator efficiency, these newly launched alarms are now highlighted in any new webapp session.
Broadcom has converted all DX NetOps fault 32-bit processes (SRAdmin, Processd, Installer) and dependent 3rd party libraries to 64-bit. Any 32-bit package dependency is now removed.
Watch a replay of our external webcast, What’s New in NetOps 21.2, to see all these features discussed and get any questions answered.
Register for our Deep Dive webcast on July 14, 2021, to see a solution demo of some of these new features.

Nagesh Jaiswal
Nagesh Jaiswal is lead product manager for network operational intelligence in the AIOps solution, within the Enterprise Software Division at Broadcom. With more than 15 years of domain experience, he is very proud to have launched many successful solutions, helping to solve customer problems with new technology.
Other resources you might be interested in
Controlling Flow Telemetry Overhead in Distributed Environments
See how the latest updates to NetOps Flow reduce telemetry overhead and optimize WAN usage. Simplify data extraction and integration with the OData 4 API.
Clarity: Managing Reports
This course is designed for report consumers who need to access, analyze, and manage published reports in Clarity.
Automic Integration Brochure
This brochure serves as your guide to the diverse tools, platforms, and systems that can connect seamlessly with Automic.
Clarity: Configure Reporting Data Sources Using Data Providers
This course explains the data foundation that supports Reporting in Clarity. Learn how Data Providers prepare, organize, secure, and validate reporting data.
Rally Office Hours: July 9, 2026
This session covers the general availability of milestone delivery confidence, troubleshooting for custom views and admin functions, and upcoming webinars.
Network Observability NCM
See how Network Observability NCM delivers network configuration management capabilities that automate remediation, ensure compliance, and mitigate risk.
Rally Office Hours: July 2, 2026
Explore the July 2, 2026, Rally Office Hours session covering OAuth security updates, the new portfolio item flow states beta, and upcoming event news.
Unleashing Enterprise Agility: The Power of Portfolio Kanban Flow States
Learn how Rally's Customizable Portfolio Item Flow States (PIFS) balance team autonomy with executive visibility to accelerate enterprise value delivery.
Chart Your Team’s Analytics Journey with Customizable Dashboards in DX NetOps
DX NetOps now features customizable dashboards, providing standards-based flexibility and an easy way for new and existing users to add custom dashboards.