June 28, 2021

DX NetOps 21.2 Innovates with Scale, Speed, and Simplicity

Written by: Jeremy Rossbach
DX NetOps 21.2 network monitoring software continues to innovate and improve the scale, speed, and simplicity of network operations with a focused set of high-value features and capabilities. Exciting new enhancements include increased monitoring scale, telemetry support, expanded SDN and cloud technology coverage, and usability and security updates.
SCALE. Networks today handle a lot of data. That's why we are proud to support the largest deployments of networking technologies around the world.
Increased Network Monitoring Scale to Meet the Demands of the Pandemic and the Evolution of Networking
The pandemic created enormous demands on today’s network. Furthermore, the evolution of networking has created an operational complexity never seen before with more technologies deployed and even more metrics to collect and measure now. These demands are here to stay, but network monitoring software scale is the equalizer.
With new monitoring capabilities to include telemetry support for real-time operational insights and expanded scale to 500,000 dense devices, 300,000 SD-WAN tunnels, 6M+ interfaces, and over 1M metrics per second, Broadcom’s DX NetOps 21.2 easily exceeds the demands of modern networking with capabilities to support today’s hyper-scale networks and ensure business continuity during the global crisis.
Expanded Monitoring Coverage for Modern Network Technologies
Broadcom continues to expand its analytic capabilities in the latest release of the DX NetOps network monitoring software to enable network operations teams to reliably deliver applications experiences over SD-WAN technologies built on VMware VeloCloud, Nokia Nuage software-defined data center (SDDC) along with Cisco Meraki cloud-managed WiFi.
The DX NetOps solution has enhanced its monitoring capabilities for Cisco Meraki MS switch devices to provide end-to-end visibility across Cisco Meraki Appliances. In previous versions of this network monitoring software, the solution enabled you to monitor Meraki MR WiFi Access Point devices and Meraki MX Security and SD-WAN appliances. DX NetOps now can collect even more key metrics of Cisco Meraki switches for improved network operations visibility and resilience of your SD-WAN and WiFi deployments.
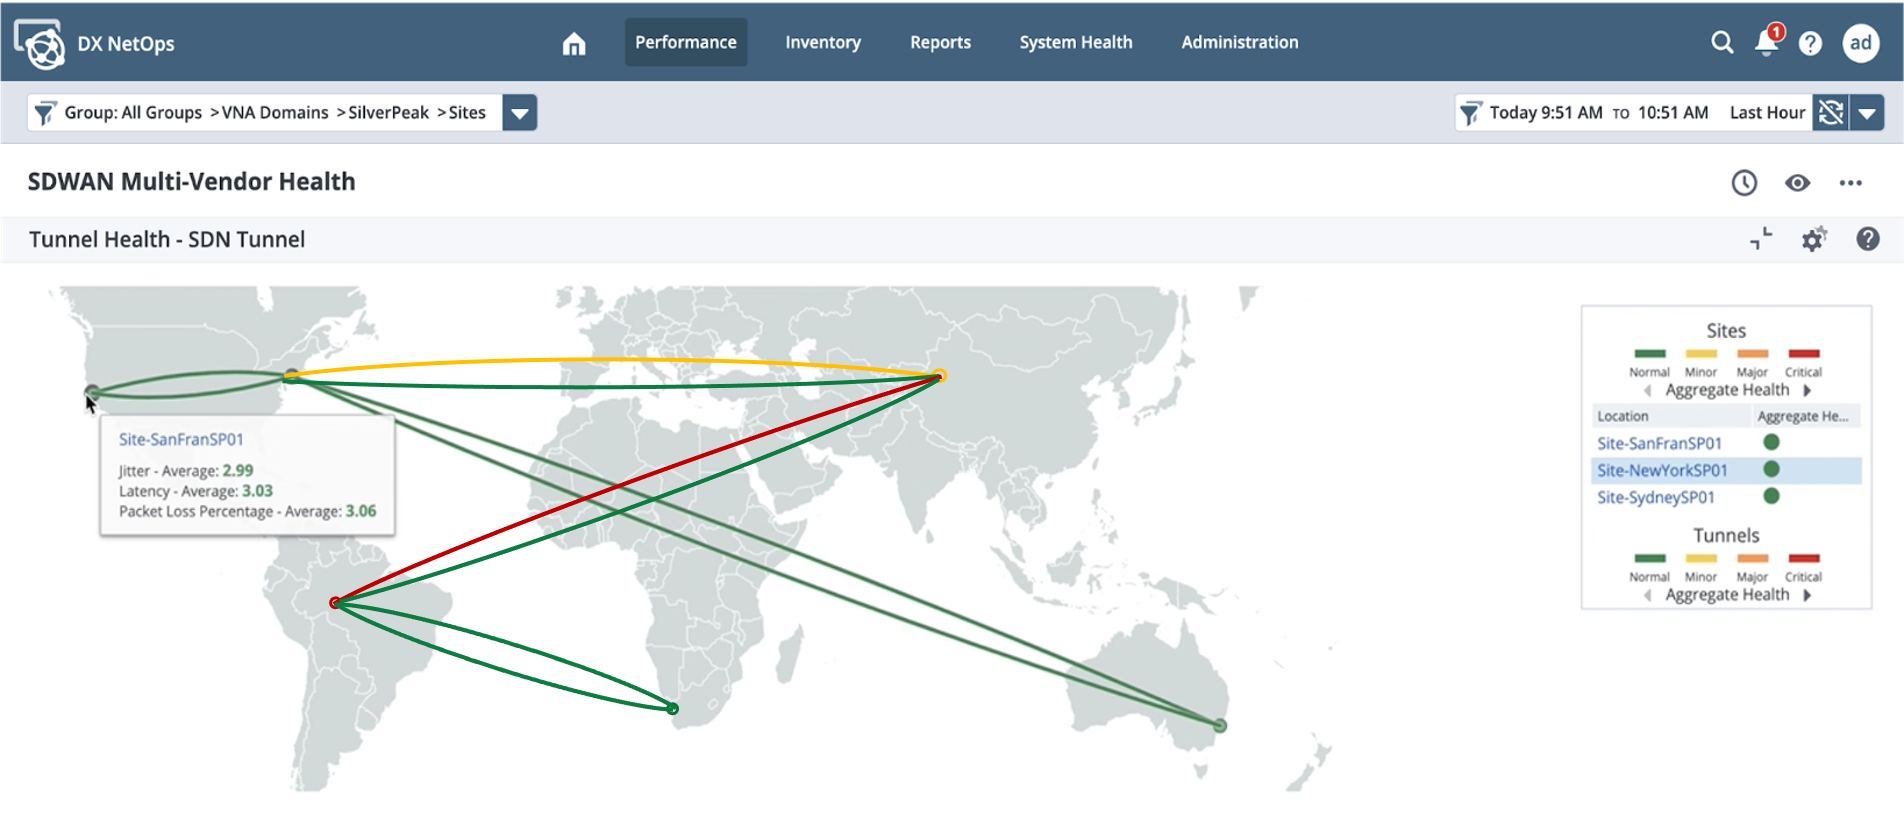
The solution has also enabled fast and easy monitoring of VMware VeloCloud SD-WAN deployments. Our enhanced network performance and fault capabilities include inventory, interface and device health, tunnel performance and information, site connectivity and topology, and events and alarms to identify network outages.

Figure 1: Interactive SD-WAN geo map delivers real-time WAN status and performance.
DX NetOps continues its innovation in SDx monitoring with coverage for Nokia Nuage SDDC deployments. The solution unifies fault, performance, and flow visibility while reducing alarm noise and delivering easy workflows that correlate the software-defined overlay with the underlay infrastructure for quick triage of this modern network technology.
SPEED. Fast triage from the initial alarm to the root cause along with quick search capabilities through millions of collected metrics to get the answers needed to resolve issues.
Real-time Insights into Network Bursts via Telemetry Collection
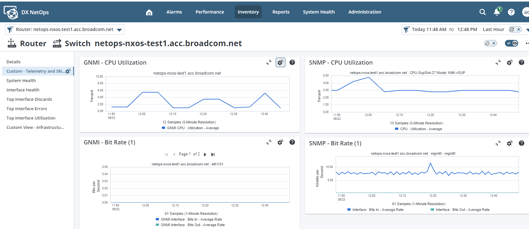
Our latest innovations enable real-time granular insights into bursts in network traffic and utilization powered by network telemetry. The gNMI Live Trend View allows operations teams to subscribe to key performance metrics like CPU, interface statistics, and sensor paths. This feature is vendor-agnostic, supports the OpenConfig data model, and continues our commitment to advancing the speed to triage and resolution for today’s network teams.

Figure 2: Telemetry-powered insights enables real-time visibility into network bursts and utilization.
Support for Syslog Events and Alarms to Isolate Network Faults
Syslog messages are an important source of potential network fault events, in addition to SNMP traps and polling. That’s why DX NetOps network monitoring software continues expanding the visibility of network operations teams and now supports this new data source for syslog-translated events and alarms to identify and isolate network faults.
SIMPLICITY. We hide the complexity of managing today’s networks from you and provide simple and intuitive workflows to triage these complex network architectures. This ensures your team and processes run smoothly and efficiently while reducing the costs of network operations.
Enhanced Alarm Noise Reduction with SDN Event Filtering
DX NetOps network monitoring software introduces a new filter mechanism with a global configuration to filter network alarms and events for all SDN/SD-WAN solutions and can be configured from the DX NetOps user interface. This new feature will allow network teams to define the filters based on the Event ID, Event Types, Fault Code, Severity, and other feasible options based on the vendor technology. Customers can then decide whether they want to blacklist or whitelist certain types of events and alarms or create actionable events or alarms. Live filter configuration changes can be made, such as Create/Update/Delete operations, with no need to restart services like engine/wildfly.
Secure Communications for Modern Network Monitoring
Broadcom has enhanced administrative workflows to enable network administrators to configure and manage security settings to protect information assets across the enterprise. DX NetOps 21.2 delivers centralized security configuration with alerting of out-of-compliance settings. Additional features include updated authentication capabilities to set secure Authentication via HTTPS and REST protocols so that data is encrypted during the authentication process. This includes the administrative user interface behind the firewall for the DX NetOps Data Aggregator, as well as secure communications with DX NetOps SDN gateway.

Figure 3: DX NetOps centralized security configuration with alerting of out-of-compliance settings.
Additional capabilities in this latest release include:
- Network configuration policy violation reports. DX NetOps can show NCM violation details like violated patterns, violated lines, missing lines, and the count through ad hoc reporting.
- Live alarm console. DX NetOps enhances fault integration with live alarm console behavior for network teams with in-line reload of individual alarms and scale up to 20,000 alarms.
- Business hours filters. You can now apply business hours filters to data in any views, dashboards, or context pages to enable pinpoint focus on a specific time period for network performance triage.
- Support for logical systems on Juniper SRX devices. Since the Juniper MIB does not expose the logical system names, we support manual discovery by supplying the logical system names through a discovery API.
- Support for new SNMPv3 authentication protocols. We have extended SNMPv3 authentication protocols to include SHA-256/512.
Register for our external webcast: “What’s New in NetOps 21.2” on July 8, 2021, to see all these features discussed and get any questions answered.

Jeremy Rossbach
As the Chief Technical Evangelist for NetOps by Broadcom, Jeremy is passionate about meeting with customers to identify their IT operational challenges and produce solutions that fit their business and network transformation goals. Prior to joining Broadcom, he spent over 15+ years working in IT, across both public...
Other resources you might be interested in
Clarity: Objects, Attributes, and Views
In this course, you will master the five core functional areas of Clarity Admin Studio configuration that form the backbone of the user experience.
Automic Automation: Getting Started with the Automic Web Interface Version 26
Get started with the v26 Automic Web Interface (AWI). Learn how to navigate the modernized UI, customize your workspace, and move between perspectives.
Automic Automation v26: Zero Downtime Upgrade (ZDU)
Learn how to employ the Zero Downtime Upgrade (ZDU) process. Transition from Automic v24 to v26 while your mission-critical workflows continue to execute.
Rally Office Hours: April 23, 2026
Learn about new tools Rally provides for moving legacy pages to custom views. Listen to technical Q&A and find out about upcoming events.
ValueOps ConnectALL: Synchronize Jira and Rally for Frictionless Cost Accounting
This course teaches you how to integrate Jira data into Rally for the purpose of frictionless cost accounting in Clarity.
AppNeta: Introducing the Intelligent Alarms Experience
Learn how to use the new Intelligent Alarms experience in AppNeta, including new metrics, new user workflows, and the new thresholding, event, and alarm system.
Rally Office Hours: April 16, 2026
Join Rally Office Hours to get expert tips and the latest product news. Explore new AI controls, Monte Carlo simulation for milestones, and more.
Announcing AutoSys 24.2: Accelerating Operations with Self-Service Agility and Automated Security
Learn how AutoSys 24.2 helps reduce administrative bottlenecks, minimize security risks, and accelerate incident resolution.
The Next Chapter for AutoSys: Moving Toward the Intelligent Control Plane
Is Broadcom still investing in AutoSys? Yes! Learn about the V26 roadmap, which features MCP orchestration, AI job types, and AI-powered developer assistance.