Human operators utilizing traditional network monitoring software with methods like SNMP, ping, or flow tracking are still limited to diagnosis and triage issues within the four walls of the on-premise data center. But with increased adoption of cloud, SD-WAN and “work from anywhere,” application workloads are getting more distributed and creating network monitoring visibility gaps.
As today’s networks become more complex, traditional network monitoring software approaches create real-time blind spots while increasing mean time to resolution (MTTR). The reason is attributed to the volume, velocity, and veracity of data generated by these modern network elements, which can’t be processed by humans anymore and require algorithmic or machine processing to be effective and efficient.
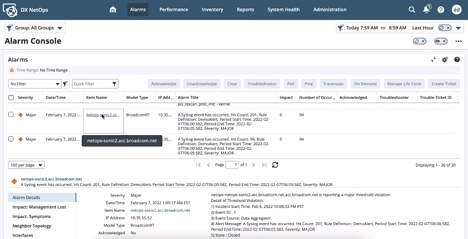
Figure 1: Unified NetOps portal for one-click log analysis and triage via alarm console
What’s the Solution?
Enterprise Management Associates (EMA) reports that 60% of large organizations consume multiple automation technologies, often from different vendors. An EMA Research survey also found that three quarters of those organizations have their critical business processes spanning these technologies. And, over a third reported significant challenges in delivering services through those technologies.
To make the triaging process more effective, the solution here is to harness the power of machine learning algorithms on top of all this collected data, providing intelligent augmentation for network operators. Historical analysis of enterprise network data, correlation of a multitude of data series, detection of trends and anomalies, as well as the realization of intent-based networking will be a reality this year.
Introducing DX NetOps Insights
DX NetOps Insights is a SaaS-based service that compliments traditional network monitoring with AI insights, improving triage time and accuracy. DX NetOps Insights helps correlate network monitoring data via faults, performance flow, inventory, metrics, topology, or logs, all together in real time. Instead of simply depending upon human knowledge, know-how of environment, or experience, DX NetOps Insights processes data via time-tested algorithms from our 30-plus years of network monitoring experience, generating insights to network operators within the unified NetOps portal.
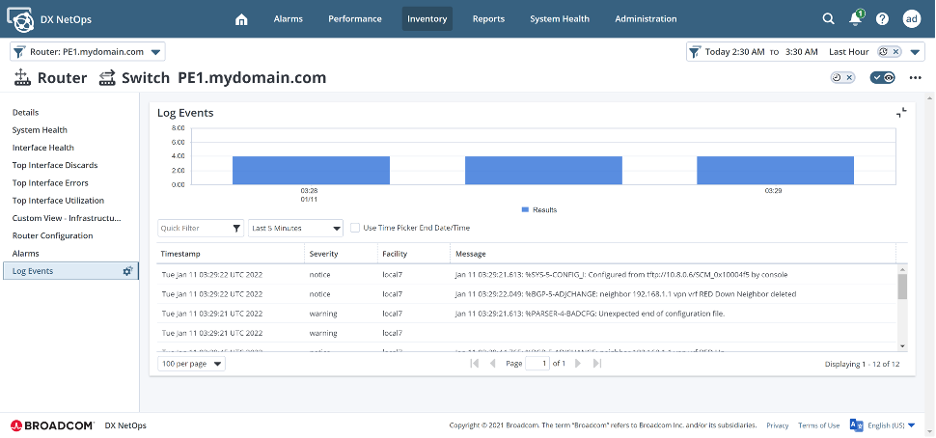
Figure 2: DX NetOps Insights enables operators to reduce meet time to resolution (MTTR) with contextual log visualizations
Key Use Cases
Log Analytics
It’s well-known that if you manage a network, every network device generates a large volume of logs. These logs are extremely important and narrate a story about the sequencing of events that have happened within your network. They are critical to helping you easily understand network activities, user actions, or security breaches.
DX NetOps Insights log analytics enables operations to contextually correlate the right set of logs and inspect millions of log lines within a few clicks on the NetOps portal. Our network monitoring software also helps you proactively monitor logs for interesting critical patterns. Additionally, correlating the right set of logs with the alert allows quicker triage by reducing resolution time from hours to minutes.
Key Highlights
- Unified tool and single-click insights within the realm of NetOps Portal
- Contextual log viewing
- Log pattern monitoring
- Kibana interface for historical log forensic
- Policy based retention and on-demand data purging
- $0 CapEx, via managed SaaS service
Future Use-Cases
Threshold Advisor
Organizations mostly rely on the knowledge and experience of network operators to define correct thresholds, then adjust and fine-tune them over time. Very often this process results in too many false positives on spurious events, while missing suspicious behaviors that could be under the surface. DX NetOps Insights’ embedded analytics will help quickly find anomalous and sustained transfer rates through a specific network device like a router to avoid downtime or SLA breaches.
Key Highlights
- Annotate Threshold violation alarms with band details
- Nominate metrics for Anomaly processing
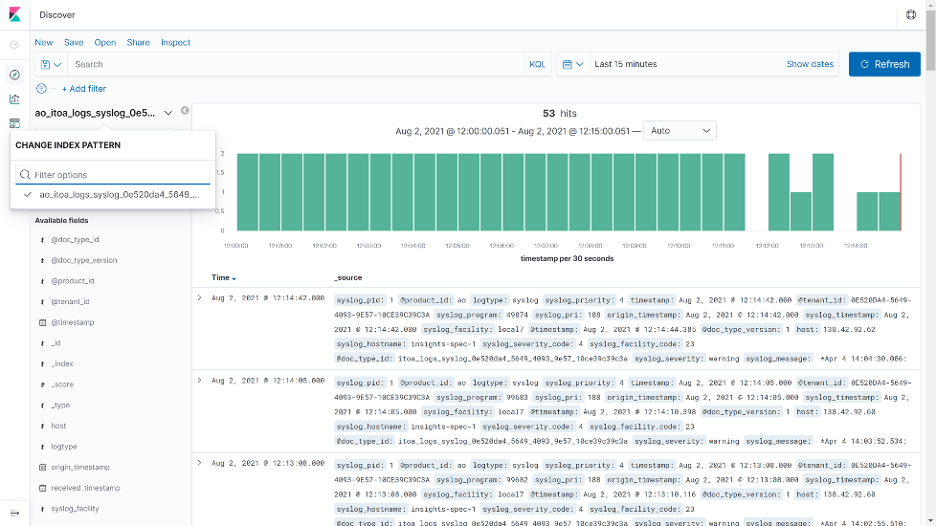
Figure 3: Kibana interface for historical forensic of logs and network events improves root cause analysis
Capacity Analytics
Very often, organizations encounter network performance issues due to excessive capacity utilization and then take a reactive approach to increasing bandwidth needs. DX NetOps Insights capacity analytics enable network engineers within network monitoring software groups to monitor the current utilization, then forecast, plan, and manage existing network resources to help mitigate any unplanned or unexpected network degradation or outage.
Key Highlights
- Showcase Capacity Trends in context of network inventory & groups
- Operators should see ‘hottest’ inventory
Conclusion
World-class network visibility means painting a complete monitoring picture of network performance. DX NetOps Insights from Broadcom Software enables IT operations teams to collect and analyze every metric important to resilient network delivery. This allows organizations to make intelligent decisions about the root cause of any performance issue related to a specific device, interface, or virtual network function.

Sandeep Tiwary
Sandeep Tiwary is a product manager for network operational intelligence for AIOps solutions at Broadcom. He has a deep understanding of and expertise in cloud technologies, along with more than 16 years of experience building and marketing software products and services. He is currently driving customer-centric...
Other resources you might be interested in
Network Observability NCM
See how Network Observability NCM delivers network configuration management capabilities that automate remediation, ensure compliance, and mitigate risk.
Rally Office Hours: July 2, 2026
Explore the July 2, 2026, Rally Office Hours session covering OAuth security updates, the new portfolio item flow states beta, and upcoming event news.
Unleashing Enterprise Agility: The Power of Portfolio Kanban Flow States
Learn how Rally's Customizable Portfolio Item Flow States (PIFS) balance team autonomy with executive visibility to accelerate enterprise value delivery.
Chart Your Team’s Analytics Journey with Customizable Dashboards in DX NetOps
DX NetOps now features customizable dashboards, providing standards-based flexibility and an easy way for new and existing users to add custom dashboards.
What’s New in Network Observability for Summer 2026
Find out about the updates coming to Network Observability by Broadcom. See how you can reduce alert fatigue, automate compliance, and simplify management.
Rally Office Hours: June 25, 2026
Explore product tips, including AI-driven story creation, and stay updated on the latest Rally news and upcoming collaborative events for July and August.
Rally Office Hours: June 18, 2026
This session covers new in-app notifications, OAuth security updates, technical Q&A on widgets, and upcoming product roadmap sessions for the community.
Clarity Roadmaps: From Strategy to Execution
Learn how to use Clarity roadmaps to connect investments, timelines, financials, and delivery commitments in a single view.
Rally Office Hours: June 11, 2026
Watch the June 11, 2026, Rally Office Hours for updates on Academy resources, custom page migration goals, AI documentation, and upcoming Q3 roadmap news.