
July 14, 2026

Latest updates to NetOps Flow optimize WAN usage and improve data extraction.
4 min read
|
Summary
|
|
Managing massive volumes of raw flow telemetry often causes network congestion and strains wide area network bandwidth. The latest updates to NetOps Flow address these challenges by introducing distributed collection architectures and open APIs. Find out how the latest release enables you to optimize performance and streamline data extraction. Key Takeaways
|
You rely on NetFlow to give you the visibility needed to trace bandwidth consumption, identify suspicious traffic patterns, and plan for future capacity requirements. However, monitoring flow data has grown increasingly complex over the past few years. As enterprise environments expand into hybrid architectures and user traffic volumes multiply, capturing and processing this data creates operational challenges.
When you send massive volumes of raw traffic data from remote sites back to a centralized monitoring system, you force local telemetry across your wide area network. Backhauling that flow data to a central server consumes valuable WAN bandwidth just to transport the records. Furthermore, once that data is collected, it often remains isolated inside a specific monitoring tool. This isolation makes it difficult to share insights with other engineering teams or integrate flow telemetry into third-party reporting.
In the Summer 2026 update to Network Observability by Broadcom, we address these evolving network complexities. We modernized the underlying architecture of NetOps Flow to give you complete control over how you collect, process, and extract your network traffic data. These updates help you scale your visibility efficiently without degrading network performance.
Scaling collection without congesting your WAN
Centralized flow collection requires you to backhaul every single flow record across your network infrastructure. If you manage a global or highly distributed environment, this architecture quickly becomes a burden. Pushing raw, uncompressed traffic logs across long-distance links generates severe overhead and drives up connectivity costs. Your monitoring traffic effectively competes with your actual business traffic.
To address this, we developed a distributed and hybrid collection architecture. You can now deploy distributed flow collectors to aggregate and process your data directly at your regional data centers or remote branch locations. Instead of forcing your infrastructure to send every packet header and flow record across the WAN, your local collectors process the data on-site. They only send the aggregated, relevant telemetry back to your central platform.
This architectural shift significantly reduces your WAN overhead. You maintain complete, granular visibility into regional traffic patterns, without paying the performance penalty of backhauling millions of individual flow records. By keeping the heavy data processing closer to the edge of your network, you ensure your monitoring infrastructure scales alongside your critical business locations. You no longer have to choose between deploying flow monitoring at a remote site and preserving bandwidth for end-user applications.
Extracting telemetry for custom visualizations
Collecting data efficiently is only half the process; you also need to use that data where it makes the most sense for your daily operations. A common frustration is having flow data isolated in a standalone application. Your IT operations teams likely rely on a variety of reporting and service management platforms. You need a straightforward way to combine your network traffic data with other operational metrics to get a complete understanding of your infrastructure status.
To make this possible, we integrated the OData 4 API standard specifically for your flow telemetry. This REST-based API allows you to extract your flow data securely and feed it directly into your preferred third-party systems. Because OData 4 provides highly structured and efficient data querying, you minimize client-side processing and reduce payload sizes during extraction. You can query exact parameters rather than pulling massive data sets, saving time and computing resources. This means your automation scripts and custom dashboards will load faster and consume less memory.
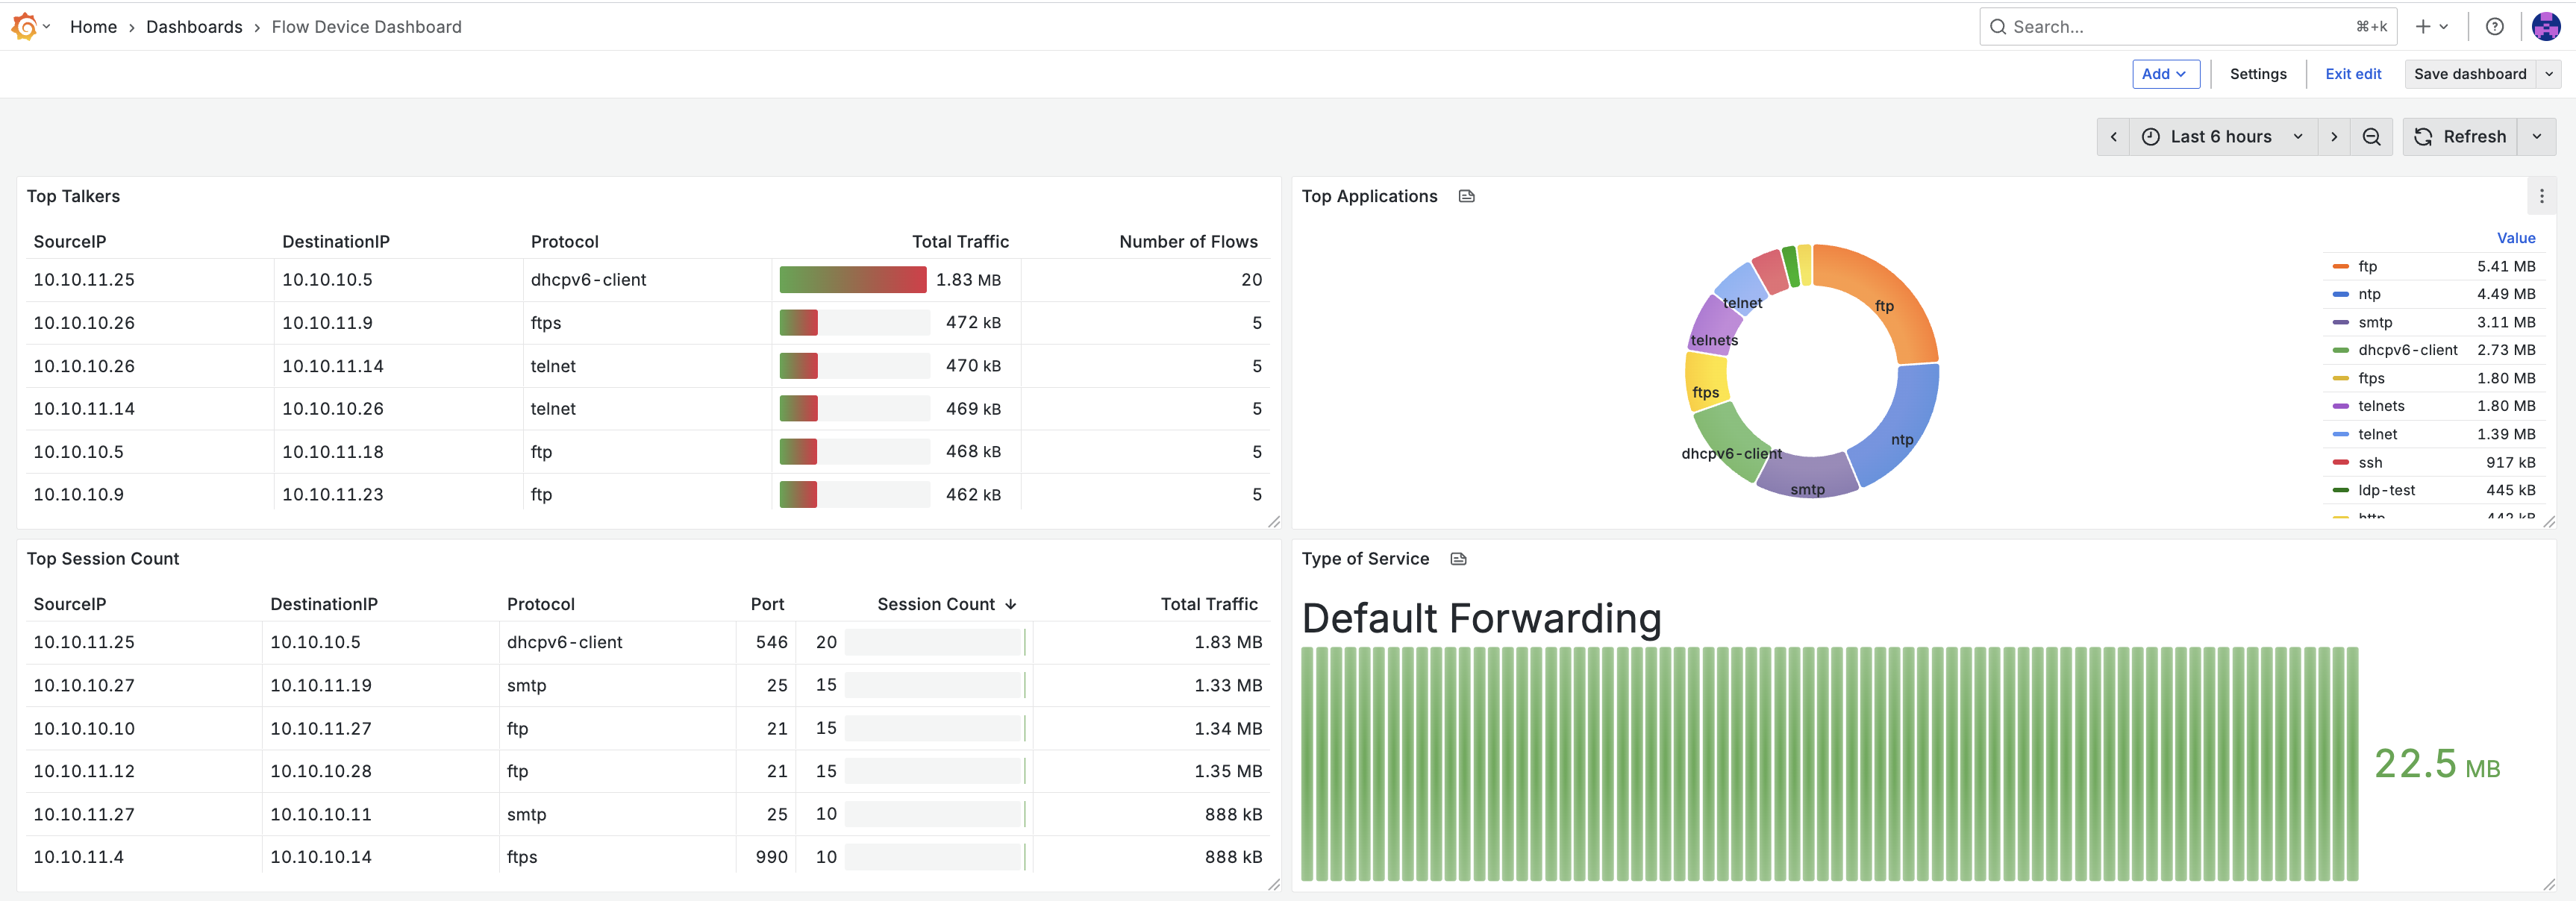
Along with this API enhancement, we enabled direct integration with the new DX NetOps customizable dashboards. If you are aiming for high-density, multi-domain troubleshooting, you can now import NetOps Flow data directly into those dashboards. You gain the ability to create highly customized visual reports, placing bandwidth consumption and protocol trends right next to other network performance indicators.
To give you more accurate context, we also added support for NBAR2 application mappings. By utilizing NBAR2, you can see exactly which specific applications are driving your bandwidth spikes. This equips you with the insights to implement more effective QoS policies or restrict unauthorized application usage.
Improving daily network operations
Managing enterprise flow telemetry requires an approach that respects your network capacity and adapts to your operational workflows. By moving to a distributed collection architecture, you protect your WAN links from unnecessary backhaul traffic. By opening up your data through the OData 4 API, you ensure flow telemetry serves your entire IT operations. These updates deliver the precise, actionable visibility you need to keep your infrastructure running smoothly, without the traditional overhead.
Join our upcoming Small Bytes session, “Optimize WAN Usage with Distributed NetOps Flow,” to see the new architecture and API updates in action.
Tag(s):
DX NetOps
,
Network Monitoring
,
Network Observability
,
Network Operations
,
Network Analytics
,
Data Visualization
,
OData
,
NetOps Flow
,
NetFlow
Helen Burke
Helen has spent her whole career working with customers on Network Observability from product support to adoption and presales. Helen specialises in working with customers to ensure that their Network Observability strategy meets their business goals.
Other resources you might be interested in

What’s New in DX NetOps Topology: Summer 2026
See what’s new in DX NetOps topology. Leverage capabilities for expanded multi-vendor discovery, faster triage, custom views, and seamless data exports.
Controlling Flow Telemetry Overhead in Distributed Environments
See how the latest updates to NetOps Flow reduce telemetry overhead and optimize WAN usage. Simplify data extraction and integration with the OData 4 API.
Chart Your Team’s Analytics Journey with Customizable Dashboards in DX NetOps
DX NetOps now features customizable dashboards, providing standards-based flexibility and an easy way for new and existing users to add custom dashboards.
What’s New in Network Observability for Summer 2026
Find out about the updates coming to Network Observability by Broadcom. See how you can reduce alert fatigue, automate compliance, and simplify management.
Automating Device and OS Compliance in Air-Gapped Networks with Agentic AI
Secure air-gapped networks by automating device compliance. Employ a hybrid agentic AI workflow that separates public intelligence from internal audits.
Migrating Your DX NetOps Integrations from OData 2 to OData 4
Moving DX NetOps to OData 4? Learn how to identify active API queries, update your endpoints, and adjust your query syntax for a seamless transition today.
Unifying Network Configuration Management and Observability
Learn how unifying Network Configuration Management with comprehensive observability eliminates operational blind spots.

DX NetOps: Unified Collection Framework Install
This course is designed to provide a clear, easy-to-follow guide for setting up and managing the Unified Collection Framework (UCF).
Debunking the Myth of the Homogeneous Network
Tame multi-vendor network chaos by harnessing a single, scalable observability platform that unifies fault, performance, and configuration data.