The process of monitoring servers and applications has undergone many transformations throughout the years. When it began, the main question was whether the server was up or down. Now, monitoring helps answer questions about the internal state of an application and infer its status (also called white box monitoring).
Monitoring today's complex infrastructure systems can be just as much an art as a technical skill. That’s because the scale of the operations has changed, and they often consist of multi-cloud or hybrid topologies running on top of orchestration platforms like Kubernetes. Now, it’s important to know how to adopt new ways to monitor Kubernetes clusters.
Keep reading for a thorough explanation of how you can learn to master the art of monitoring in Kubernetes from the ground up.
Monitoring as It Used to Be
Not very long ago, the fundamentals of application monitoring were reasonably straightforward: you collected data, analyzed the data for anomalies, then manually addressed the problem. Some companies didn’t even need to use monitoring tools until they encountered real performance issues.
The layout was also simpler. The physical server rack was accessible nearby, and you collected syslogs, parsed them using scripts, and occasionally used Linux commands like top and vmstat to review performance issues. With the proliferation of internet services and operating systems, you could get tools like Nagios or Zabbix (with some workarounds) to handle the heavy lifting of performance monitoring.
Today, our new technological advancements and architectures have created new problems for these monitoring solutions. Don’t get me wrong – they are still invaluable when it comes to monitoring simple installations. However, they are not enough for complex systems. We’ll explain why next.
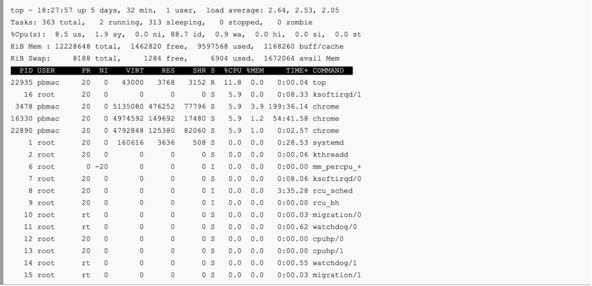
Your Trusty Old Top Command Is Not Enough Anymore
Monitoring in the Era of Microservices
The ever-increasing adoption of microservices is making logging and monitoring more and more complex due to the radical changes in the nature of application architectures and the infrastructure hosting them. To counteract that problem, container orchestration platforms like Kubernetes help mitigate the complexity of distributed processing, but they also make monitoring even more difficult.
The reason for this problem is straightforward: adopting a massive scale of services spanning thousands of instances requires an enormous technological leap, and only the most prepared companies can handle that huge increase in complexity. Kubernetes and cloud computing are radical new technologies, and it takes time for engineers to learn and practice the necessary skills to be able to utilize them effectively. There have also been changes to teams and roles: IT Ops has become DevOps, and Security Ops has become DevSecOps. These teams face the same problems, but they also have to deal with stricter requirements as well as new technologies.
In addition, the frequency of software distribution has accelerated rapidly with the adoption of these new technologies. Today, it’s not surprising to see hundreds or even thousands of deployments per day. Monitoring tools have to be able to keep up with this pace, and they have to up their game in terms of operational scalability, visibility, and accuracy.
The rest of this article will focus on explaining how to monitor Kubernetes environments effectively.
Monitoring Kubernetes Environments
In a Kubernetes environment, there are many different components that can cause failures — the API server, the kubelet agent, the master node, or a worker node. Since there are so many variables, you have to use innovative techniques to be able to see the big picture.
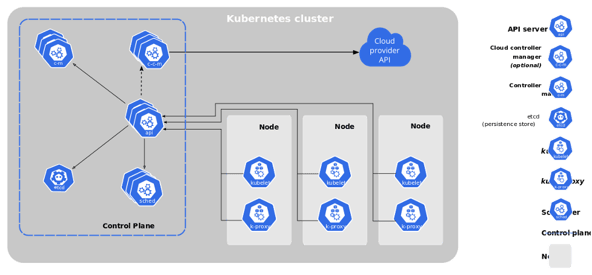
Kubernetes Architecture (image from Kubernetes.io)
Looking at this diagram of the Kubernetes architecture, you may think that it’s simple enough to monitor. However, there are many complexities that aren’t immediately obvious. For example, unless you use a managed K8s service, you’ll need to monitor not only the control plane components, but also their future fluctuations in scale. Nodes and pods can also be autoscaled on demand, which would expand the diagram above to include additional horizontal layers of components that need to be monitored.
The very nature of Kubernetes makes it impossible to establish a baseline of ordinary activity that you can use to detect anomalies. The number of instances of microservices can fluctuate constantly in response to demand, as can the network traffic patterns and the resources allocated to host infrastructure.
For the most part, Kubernetes offers greater resource utilization if it’s configured correctly. However, the tradeoff is that it comes with more frequent asymptomatic failures. Kubernetes is not flawless. It contains many millions of lines of code, so there are many unknown bugs or failure scenarios that have yet to be uncovered.
Fortunately for us, there are many effective monitoring tools that can surface and address these problems. We’ll explain the main challenges of monitoring Kubernetes below.
Main Challenges of Monitoring Kubernetes
If you were to utilize traditional monitoring tools to monitor Kubernetes deployments, you would quickly find out that they can't handle that type of complexity. This is why the market has shifted toward observability solutions that can map the complex relationships between the various parts of an application and the infrastructure on which it runs. Kubernetes has revolutionized the way applications are architected and run, but it has also revolutionized the way application performance must be tracked and managed.
The shift from monitoring to observability requires a shift in operational practices and a greater willingness to adopt closer communication between teams. Monitoring a small cluster with a default configuration might be easy to manage, but if you want to expand to multiple clusters with thousands of nodes, you’ll soon have to handle millions of metrics. Therefore, you’ll need to establish and agree on a rock-solid approach to monitoring tools and services.
There are several open source Kubernetes monitoring solutions available, and it’s essential that you choose the right one for your organization. You should establish a baseline observability stack, then choose your solution and adjust it to your needs. An excellent starting point is Observability-driven development, in which you use observability to illuminate each of the potential anomalies that you might encounter so that you can learn from your mistakes. This way, you can respond to unusual scenarios faster and with greater accuracy. Next, we’ll explain some more ways to improve this process.
The Art of Monitoring Kubernetes Successfully
When it comes to monitoring Kubernetes, it takes substantial effort to achieve surgical accuracy. Using pre-configured dashboards that give you improved visibility into your operations is an enormous step forward. Metrics should be partitioned by pod or level and contain CPU, memory, and service latency levels. You’ll need to take advantage of your experience as well as new technologies like eBPF to capture information straight from the kernel.
It also helps to utilize vendor-agnostic agents for instrumentation. That’s because the monitoring industry is volatile, and you may have to swap agents later. If you can get away with leveraging open standards, that’s even better. Broadcom’s DX APM solution, for example, has seamless integration with OpenTracing.
Finally, you want to leverage advanced technology and novel solutions like DX Operational Intelligence that will give you the upper hand when it comes to intelligent automation. With DX Operational Intelligence, you gain accuracy and full-stack observability which eliminates false positives by generating real, actionable insights.
With these optimizations, you can turn your plain old monitoring duty into an advanced yet effortless process by leveraging technology that can do much of the work for you. The hardest part is the initial onboarding of the Kubernetes ecosystem. Once you’ve done that, you can scale your monitoring to cover any level of complexity.
For more on DX Operational Intelligence, visit Broadcom’s DX Operational Intelligence resource pages on Academy.

Theo Despoudis
Theo Despoudis is a Senior Software Engineer, a consultant and an experienced mentor. He has a keen interest in Open Source software Architectures, Cloud Computing, best practices, and functional programming. He occasionally blogs on several publishing platforms and enjoys creating projects from inspiration. Follow...
Other resources you might be interested in
Network Observability NCM
See how Network Observability NCM delivers network configuration management capabilities that automate remediation, ensure compliance, and mitigate risk.
Rally Office Hours: July 2, 2026
Explore the July 2, 2026, Rally Office Hours session covering OAuth security updates, the new portfolio item flow states beta, and upcoming event news.
Unleashing Enterprise Agility: The Power of Portfolio Kanban Flow States
Learn how Rally's Customizable Portfolio Item Flow States (PIFS) balance team autonomy with executive visibility to accelerate enterprise value delivery.
Chart Your Team’s Analytics Journey with Customizable Dashboards in DX NetOps
DX NetOps now features customizable dashboards, providing standards-based flexibility and an easy way for new and existing users to add custom dashboards.
What’s New in Network Observability for Summer 2026
Find out about the updates coming to Network Observability by Broadcom. See how you can reduce alert fatigue, automate compliance, and simplify management.
Rally Office Hours: June 25, 2026
Explore product tips, including AI-driven story creation, and stay updated on the latest Rally news and upcoming collaborative events for July and August.
Rally Office Hours: June 18, 2026
This session covers new in-app notifications, OAuth security updates, technical Q&A on widgets, and upcoming product roadmap sessions for the community.
Clarity Roadmaps: From Strategy to Execution
Learn how to use Clarity roadmaps to connect investments, timelines, financials, and delivery commitments in a single view.
Rally Office Hours: June 11, 2026
Watch the June 11, 2026, Rally Office Hours for updates on Academy resources, custom page migration goals, AI documentation, and upcoming Q3 roadmap news.