While there is no way to completely eliminate white noise, there are several key considerations that can help improve outcomes while monitoring your servers. Here, we’ll look at what your solution should be able to do, how you should use it, and when you need to closely examine events.
What type of solution do you need?
Modern IT Infrastructure Monitoring (ITIM) solutions — such as Broadcom’s DX Unified Infrastructure Management (DX UIM) — offer a breadth of visibility options and can be overwhelming if you are not sure of why you are looking at certain metrics. You can work with your domain specialists and subject matter experts to identify the critical metrics, conditions, and events for the systems that comprise your infrastructure. Gartner’s 2021
"Market Guide for IT Infrastructure Monitoring Tools" report recommends using the metrics to determine the
right monitoring tools for your business.
You can also step back and consider that in the modern world of IT infrastructure, the conditions you need to look at are far beyond simple metrics. A modern tool should provide insights such as:
- Availability
- Performance metrics
- Service/daemon/process health
- Log analysis
- Physical/virtual and cloud/on-premise/hybrid
The solution should also be able to leverage visibility from other tools in the chain, either through integration or as part of an aggregate in a larger solution.
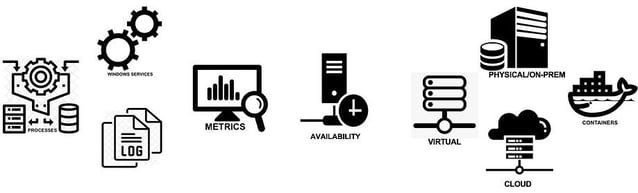
Figure 1: You should align a possible solution’s capabilities with your business needs first, then fill in gaps with other tools
How should you deploy your solution?
You may find yourself deploying an infrastructure monitoring solution and falling into the trap of monitoring everything.
The platform on which you monitor the server can also exacerbate the issue. Physical versus virtual, on-premise versus cloud, and running directly in an application versus through containers can all impact the amount of data being collected and in some cases will double or triple similar data points. For example, you may only need to know what the hypervisor is reporting versus the operating system, or vice versa. Collecting both would potentially increase the amount of alarms being generated.
If you have already identified the conditions you need to monitor to ensure availability, the next step is to distinguish between normal and abnormal behavior. You can perform this assessment by establishing baselines, measuring key performance indicators over a period of time, and using historical records of outages to determine what extraordinary events occurred during these outages. You can also leverage the expertise around you to correlate events; for example, a spike in a particular metric might coincide with what would normally be an informational entry in a log.
According to Gartner’s report, you should provide contextualized data through metric or data analytics to enable root-cause analysis of alarms. You should also focus on a superset of metrics that are relevant, while avoiding adding unnecessary metrics at this stage. You can then add layers as your requirements change.
Some conditions — such as disk space on the system and application drives of either a physical or virtual server — are straightforward and should always be monitored. However, conditions such as CPU or memory usage, while relevant, do not need to trigger an actionable alarm unless you know it will be related to a potential outage or service degradation.
CPU usage greater than 90%, for example, could trigger a critical alarm but actually be part of the white noise loop. Instead, use the knowledge of your environment and its history to determine what the alarm thresholds should be, ideally in relation to other seemingly separate events.
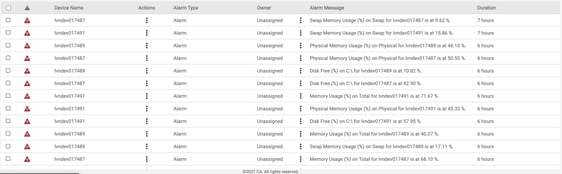
Figure 2: You can mitigate alarm deluge by carefully considering what is truly a critical event
You can also use features such as time-over-threshold to reduce noise by triggering alarms only when a condition is "sustained." This avoids the "toilet-flap" condition where a metric triggers an alarm, only for the condition to immediately clear itself and restart the loop, creating a series of unending alarms.
When should you dig into the data?
When to look at a metric or event is important to alarm reduction. While the world has moved past the days of "busy in the day, slow at night" to 24/7/365 cycles, you can still use baselines and history to determine when outages are likely to occur – and the conditions that arise concurrently. Using the CPU usage example above, a spike may indicate normal behavior but could also precede something dire during a busier time.
An older example is what happens when backups occur at night. Typically, we expect higher utilization during this time and therefore expect the backup wouldn’t trigger an alarm. However, today the expectation is for servers to be utilized at maximum capacity whenever possible. If we accept that utilization should be higher (within parameters) during business hours, then low utilization could indicate a fault in a container or application residing on the server.
Seasonality can also be a factor. Using historical performance, event, and alarm data to adjust thresholds or allocate extra capacity during different times of the year can prevent outages and alarms. You should avoid using static thresholds that do not adjust for seasonality. A modern solution can dynamically adjust the values for you based on your environment’s historical trends.
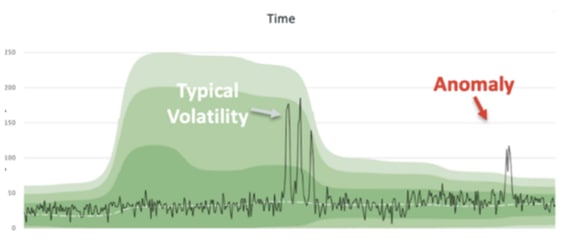
Figure 3: you can use baselines and historical data to identify predictable trend and anomalous conditions with integration to DX Operational Intelligence
ITIM tools are a pillar in server monitoring, and proper usage can aid in alarm reduction. You can fully realize this vision by making them part of a larger solution. Broadcom’s DX Operational Intelligence provides a complete holistic view of your IT Operations Management chain, including infrastructure, NetOps, APM, and automation.
For more resources on infrastructure monitoring, visit DX UIM on Broadcom’s Enterprise Software Academy.

James Park
James has been a sales engineer for over 15 years, helping businesses solve their problems. He has focused on IT infrastructure observability and reliability. When he’s not working, he enjoys spending time with his wife and children, reading, weight training, and playing triple bogey golf.
Other resources you might be interested in
Network Observability NCM
See how Network Observability NCM delivers network configuration management capabilities that automate remediation, ensure compliance, and mitigate risk.
Rally Office Hours: July 2, 2026
Explore the July 2, 2026, Rally Office Hours session covering OAuth security updates, the new portfolio item flow states beta, and upcoming event news.
Unleashing Enterprise Agility: The Power of Portfolio Kanban Flow States
Learn how Rally's Customizable Portfolio Item Flow States (PIFS) balance team autonomy with executive visibility to accelerate enterprise value delivery.
Chart Your Team’s Analytics Journey with Customizable Dashboards in DX NetOps
DX NetOps now features customizable dashboards, providing standards-based flexibility and an easy way for new and existing users to add custom dashboards.
What’s New in Network Observability for Summer 2026
Find out about the updates coming to Network Observability by Broadcom. See how you can reduce alert fatigue, automate compliance, and simplify management.
Rally Office Hours: June 25, 2026
Explore product tips, including AI-driven story creation, and stay updated on the latest Rally news and upcoming collaborative events for July and August.
Rally Office Hours: June 18, 2026
This session covers new in-app notifications, OAuth security updates, technical Q&A on widgets, and upcoming product roadmap sessions for the community.
Clarity Roadmaps: From Strategy to Execution
Learn how to use Clarity roadmaps to connect investments, timelines, financials, and delivery commitments in a single view.
Rally Office Hours: June 11, 2026
Watch the June 11, 2026, Rally Office Hours for updates on Academy resources, custom page migration goals, AI documentation, and upcoming Q3 roadmap news.