|
Key Takeaways
|
|
Today’s enterprise networks aren’t constrained to a single location—they span continents, clouds, and providers, and they’re relied upon by users who can work from anywhere. For network operations teams, that means every issue is a potential scavenger hunt. Is it the app? The WAN? The cloud provider? The ISP?
The stakes are high and your tools need to evolve. That’s why the integration of DX NetOps and AppNeta is such a game-changer. It gives teams a unified view of what’s really happening—wherever it’s happening.
For years, DX NetOps has been the go-to solution for monitoring modern data center networks—providing rich visibility, real-time insights, and scalable support for even the most complex infrastructures.
But today’s IT ecosystems aren’t confined to the data center. They’re cloud-first, hybrid, global, and fast-moving. You’re dealing with remote users, SaaS apps, cloud service providers, and third-party networks. That’s where AppNeta comes in—extending visibility far beyond your four walls into ISP and cloud provider territory.
So, what’s even better than having both DX NetOps and AppNeta in your toolset? Bringing them together in a single, unified view.
Thanks to recently improved integration capabilities, achieving that unified visibility isn’t just possible—it’s simple. This is a big win for network operations teams who are under pressure to move fast, solve problems before they escalate, and deliver flawless user experiences.
In this post, we’ll break down what this combined power looks like in practice. You’ll get:
- A quick look at both tools and how they complement each other.
- A real-world scenario of how a global organization used this integration to respond to a critical issue.
- Step-by-step tips for getting this all up and running in your own environment.
Let’s dive in.
Meet Network Observability by Broadcom
Network Observability by Broadcom delivers end-to-end network visibility and actionable insights that help operations teams keep services available, optimally performing, and aligned with user expectations.
It’s powered by two key products: DX NetOps and AppNeta. Let’s take a quick look at what each one brings to the table.
DX NetOps: Built for scale and complexity
DX NetOps delivers unified, scalable network monitoring across both traditional and modern environments—including SDN, cloud, and virtual infrastructure. It helps you monitor everything from routers and switches to APIs and microservices.
With DX NetOps, you can:
- Detect issues early.
- Monitor performance trends.
- Drill into root causes quickly.
- Correlate alarms across layers and domains.
AppNeta: See the entire digital path
AppNeta is all about going beyond your own network. It provides active monitoring from the end-user perspective—measuring performance across every hop of a network path, including those that span ISP, cloud, and SaaS vendor networks.
Unlike passive monitoring tools that wait for something to go wrong, AppNeta actively tests the network and pinpoints exactly where issues originate.
AppNeta delivers these key features:
- Continuous active synthetic network monitoring combined with application monitoring.
- Hop-by-hop visibility across internet and cloud paths.
- Real-time measurement of network health and app experience.
- Alerts tied to thresholds or performance anomalies.
AppNeta Experience: Layer 7 insights that cut through noise
One standout component is AppNeta Experience, which focuses on Layer 7 synthetic monitoring—giving you insight into the actual user experience within web applications.
With the product, you move beyond determining whether the network is up. You can ascertain if users can reach the login screen, whether they can they sign in, if they can browse and add an item to a shopping cart, and more.
AppNeta Experience uses Selenium-based scripts to simulate real user behavior at the application layer. It does this from multiple monitoring points across your network, so you can:
- Distinguish between app issues and network problems.
- Test every step of critical user workflows.
- Correlate issues to specific servers, browsers, or geographic locations.
The best part? All this data can be fed directly into your DX NetOps Portal. That means you get a single pane of glass to troubleshoot the entire digital experience—across your infrastructure, your provider network, and the cloud.
How it works in practice: Troubleshooting a performance issue
So, how does this all come together? Let’s walk through a real-world troubleshooting scenario to show you how it works.
Start at the NetOps alarm view
Imagine you’re a network administrator and you get an alert that something’s off. You open up the DX NetOps alarm portal and immediately sort by impact.
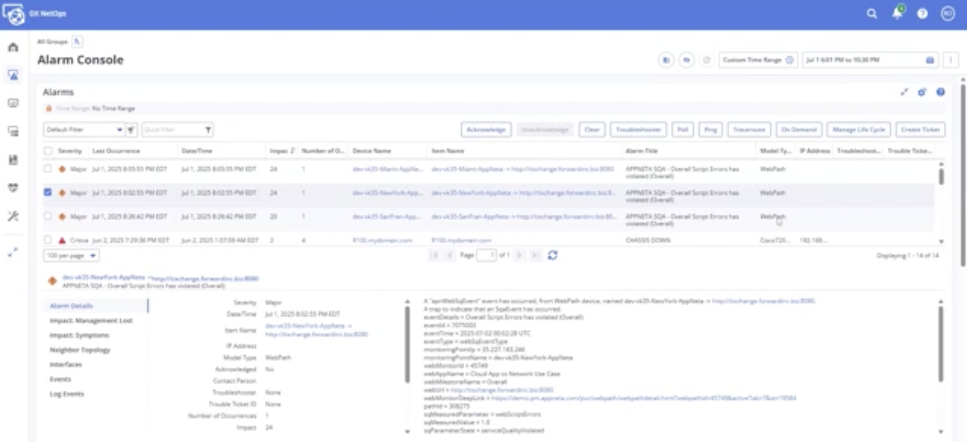
You see a web path violation—an alarm from AppNeta Experience saying that something in your application path has failed.
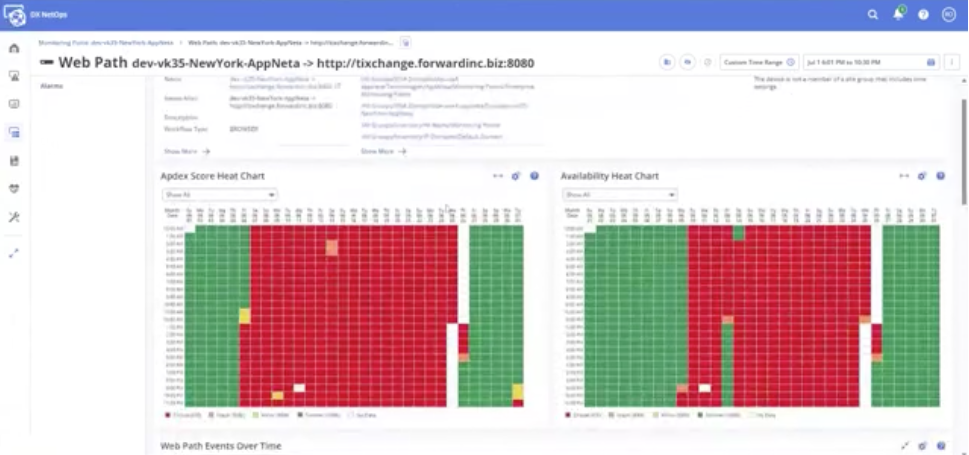
Next, you click into the alarm and drill into the specific monitoring location. From there, you can see:
- The response time has spiked during certain intervals.
- The Apdex score (a measure of user experience) has dropped significantly.
- Detailed step-by-step transaction data, from login to checkout.
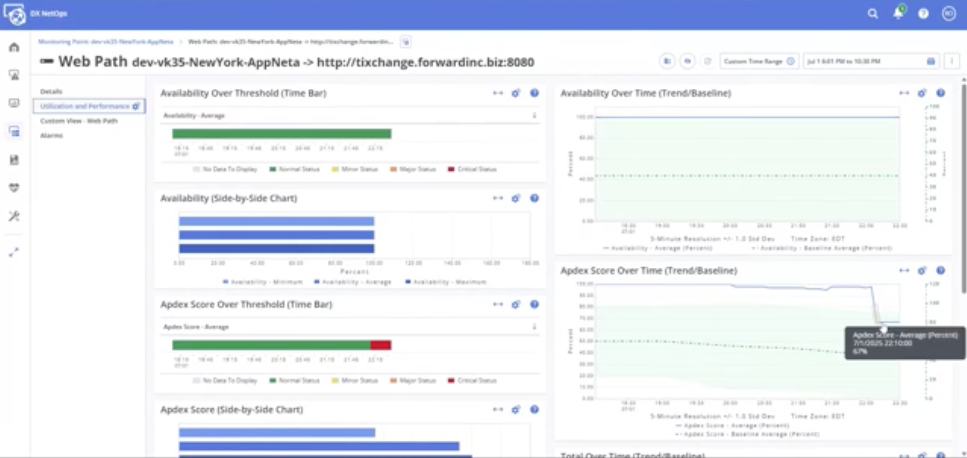
Slice your views however you need
Next, you can filter the data by:
- Network performance, including packet loss and latency.
- Server response times.
- Browser rendering times.
In this case, network performance looks normal. No packet drops. No excessive latency. However, you can see server response times have suddenly shot up. Worse, the application is returning error pages right after login.
Now you know: It’s not the network. It’s the application.
You can hand this off to your app team—with full context, data, and screenshots—so they can dive into logs and fix the issue. No finger-pointing. No wasted time.
You can also reference historical baselines to compare what “good” looked like last week, last month, or last year.
Customer example: Global cosmetic company sees real results
One global cosmetics manufacturer recently reaped the benefits of this integration—and it couldn’t have come at a better time.
The company relies on a managed service provider (MSP) to run its SD-WAN environment, which connects 250 remote sites around the world. That setup offers great scale—but also introduces a major dependency. If something goes wrong in the provider’s network, critical services could suffer. What’s worse, without the right visibility, internal network operations teams could be left in the dark.
A few weeks ago, an issue did arise in the MSP’s network. Suddenly, they noticed:
- A dramatic drop in network capacity.
- Widespread packet loss.
- User complaints from across regions.
Thanks to the combined power of DX NetOps and AppNeta Experience, the team was able to get a full view of the end-to-end network path—from branch office to MSP backbone to their own data center.
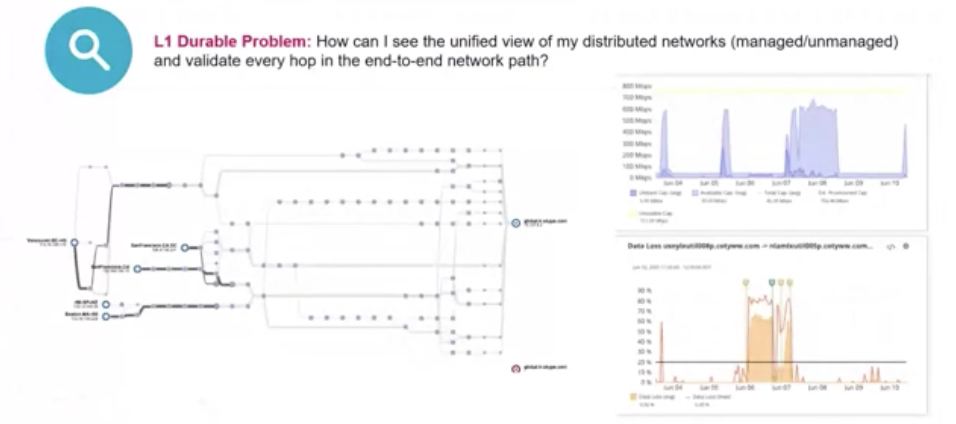
With this visibility, they quickly ruled out any issues in the infrastructure they owned. Instead, they pinpointed the exact hops within the MSP network that were dropping packets.
They didn’t just hand off a generic “something’s broken” ticket to their MSP. They gave them specific data points, including times and hop-by-hop performance metrics.
That allowed the provider to fix the issue faster—and gave the cosmetics company the objective proof they needed to hold the provider accountable for their SLAs.
Integration: How it works
Through this integration, your teams can bring AppNeta Experience intelligence into DX NetOps. Once established, you can have alerts in DX NetOps that are based on this intelligence, and start to leverage unified troubleshooting capabilities, such as opening incident tickets and so on.
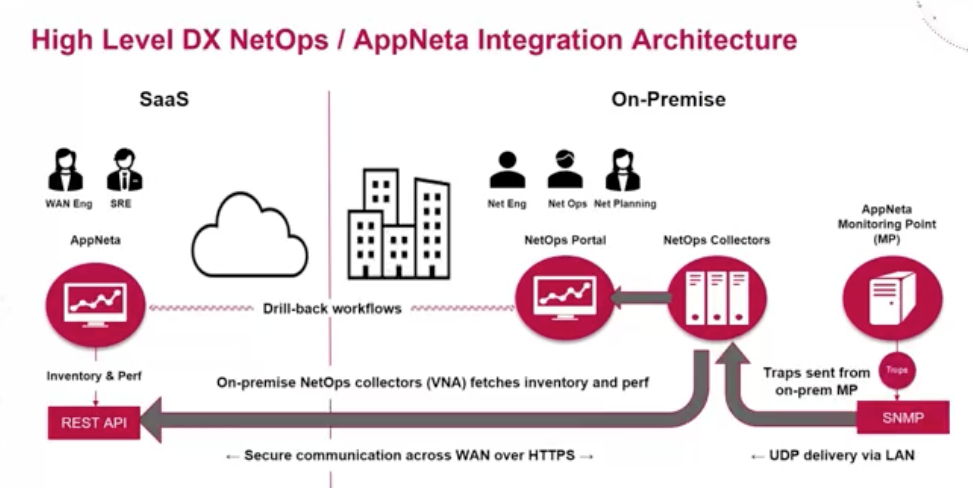
Here’s an overview of the components involved, and how they intersect:
- AppNeta is typically run as a SaaS solution.
- DX NetOps Virtual Network Assurance (VNA) is used to collect data from AppNeta.
- VNA connects to the tenant using the Rest API.
- AppNeta runs transactions from monitoring points, which can be physical or virtual.
- These monitoring points send SNMP traps to the fault management component, such as Spectrum within DX NetOps.
In this way, you can start to see a complete picture, including inventory, fault, and performance details, all in one place.
Here are the types of SNMP notifications that are supported:
- Delivery, including network path violations, clear events, and change events.
- Experience, including web path violations and clear events.
- Monitoring points, including new, contact lost, or contact established events.
Setting up the integration: How to bring it all together
Now that you have an idea of the potential value, here’s how you can connect AppNeta and DX NetOps in your own environment. Integration is done within each product.
1. AppNeta
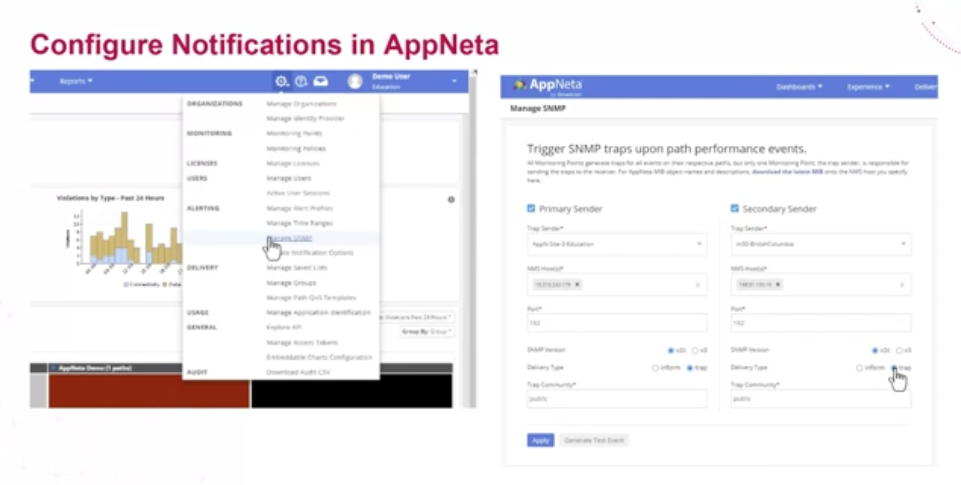
In AppNeta, here are the steps to take:
- Go to Settings > Alerting > Manage SNMP.
- Define your primary and secondary monitoring points, which can be physical or virtual.
- Choose your SNMP version, whether v2 or v3.
- Enter the NMS host (the Spectrum servers) that will receive traps.
- Define the delivery type and SNMP trap credentials.
2. DX NetOps
Next on the DX NetOps side, you configure the solution to receive alerts from AppNeta by taking the following steps:
- Configure the AppNeta plug in.
- Enter the host, protocol, authentication token, and domain you’re using.
- Create an AppNeta admin model, plug in IP addresses of monitoring points, and configure them as trap senders.
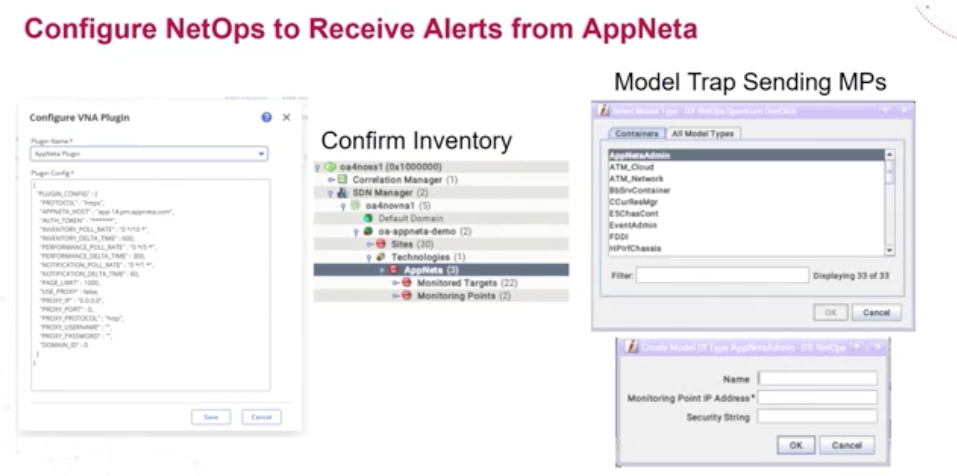
This process will be familiar to any users who have done other integrations via VNA.
Conclusion
As networks grow more complex and user connectivity extends far beyond the data center, traditional tools alone just aren’t enough. But when you bring DX NetOps and AppNeta Experience together, you gain total visibility—from core to cloud and everything between.
With this visibility, you can skip the hunting and guesswork, troubleshoot faster, collaborate better, and deliver the kind of digital experiences your users expect. Whether you're running thousands of remote sites, relying on cloud providers, or managing SaaS-heavy environments, this integrated solution gives you the clarity and control you need.
It’s no longer just about monitoring what you own. It’s about seeing and understanding everything that matters.
To learn more, be sure to view our Small Bytes webcast, Integrate AppNeta Experience into DX NetOps. In addition, you can also access our MegaBytes page to see an extensive list of more in-depth solution demonstrations, including sessions that cover AppNeta and DX NetOps integration.

Robert Kettles
Robert Kettles started off as a field engineer at Cabletron Systems supporting LAN/WAN switching and routing solutions along with their relatively new network management platform: Spectrum. Over two decades later, he continues to help customers solve network fault and performance management challenges.
Other Network Observability resources you might be interested In
What’s New in DX NetOps Topology: Summer 2026
See what’s new in DX NetOps topology. Leverage capabilities for expanded multi-vendor discovery, faster triage, custom views, and seamless data exports.
Rally Office Hours: July 23, 2026
Watch the Rally Office Hours from July 23, 2026, featuring updates on custom page migration, governance work rules tips, and upcoming widget releases.
Rally Office Hours: July 16, 2026
This July 16, 2026 Rally Office Hours session highlights a new custom pages substitution variable, custom page migration updates, and community Q&A.
Controlling Flow Telemetry Overhead in Distributed Environments
See how the latest updates to NetOps Flow reduce telemetry overhead and optimize WAN usage. Simplify data extraction and integration with the OData 4 API.
Clarity: Managing Reports
This course is designed for report consumers who need to access, analyze, and manage published reports in Clarity.
Automic Integration Brochure
This brochure serves as your guide to the diverse tools, platforms, and systems that can connect seamlessly with Automic.
Clarity: Configure Reporting Data Sources Using Data Providers
This course explains the data foundation that supports Reporting in Clarity. Learn how Data Providers prepare, organize, secure, and validate reporting data.
Rally Office Hours: July 9, 2026
This session covers the general availability of milestone delivery confidence, troubleshooting for custom views and admin functions, and upcoming webinars.
Network Observability NCM
See how Network Observability NCM delivers network configuration management capabilities that automate remediation, ensure compliance, and mitigate risk.