September 18, 2024

Four Simple Steps for Streaming DX NetOps Alarms into Google BigQuery

Written by: Nestor Falcon Gonzalez
|
DISCLAIMER: This blog describes a field-developed pilot not officially supported by Broadcom. The vendor does not provide any warranties or support for issues arising from this implementation. |
|
Key Takeaways
|
|
In today's interconnected world, ensuring network reliability and performance is not just important—it's a must. Network alarms serve as the first line of defense in identifying and mitigating potential issues, providing network operations teams with the actionable insights they need to respond swiftly and effectively. To truly empower network operations teams to boost agility and efficiency, these alarms must be real-time and actionable.
Organizations can significantly enhance their network observability strategy by implementing a streaming network alarm pipeline. This approach offers many benefits, including in-depth performance analysis, rigorous compliance and auditing, and the potential for advanced machine learning and predictive analytics. These streaming pipelines can help with immediate issue detection and forecasting future network anomalies, leading to a more proactive operational stance.
This post will walk you through the process of building a robust streaming data pipeline by using Kafka to send DX NetOps by Broadcom events to Google BigQuery. Once the data is in BigQuery, we’ll explore how to leverage Google Looker to visualize key insights, turning raw network data into actionable intelligence that promotes better decision-making and enhances overall network performance.
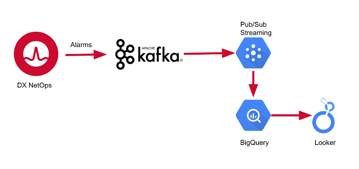
Figure 1: Streaming data pipeline components.
Step 1: Integrate DX NetOps with Apache Kafka
We begin by integrating DX NetOps (Spectrum) with Apache Kafka to publish network alarms. DX NetOps offers seamless, out-of-the-box integration with Kafka, making the setup straightforward. The key step is configuring the Kafka alarm producer—a client that operates on a OneClick Server and publishes alarms to the Kafka cluster.
To configure this integration, navigate to the configuration file located on the OneClick server at the following location:
<$SPECROOT>/tomcat/conf/application-spring.properties
Within this file, you'll need to specify the Kafka cluster details, including the broker's IP address, port, and the Kafka topic where the alarms should be published. After entering the necessary information, simply restart the OneClick process, and your alarms will start flowing into the Kafka cluster.
To visualize the DX NetOps alarms being published, you can use any open-source Kafka UI tool. These interfaces will allow you to check alarms published into Kafka messages.
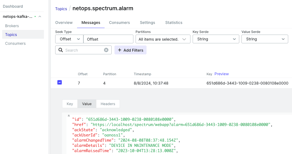
Figure 2: TMF payload for the events.
To learn more, view our technical documentation, which features in-depth information on the Kafka integration.
By integrating DX NetOps with Kafka, you unlock a wide range of powerful use cases. This setup enables the automated creation of service desk tickets directly from Kafka events, streamlining incident management. It also facilitates easy integration with data lakes, such as Elasticsearch or Splunk, allowing for advanced analysis and correlation across various platforms. These capabilities not only enhance your network observability but also pave the way for more efficient operations and data-driven decision-making.
Step 2: Create a BigQuery dataset
The next step involves determining where to store the DX NetOps alarms within Google Cloud. For this, we'll use Google BigQuery, a fully managed, AI-ready data platform that simplifies complex data analysis and provides powerful capabilities for querying large datasets.
Start by logging into your organization's Google Cloud Platform account. Once logged in, enable the BigQuery service if it's not already active. Next, create a BigQuery dataset and a table within it, following the structure outlined below. This setup will serve as the repository for your DX NetOps alarms, enabling efficient storage, retrieval, and analysis of your network data.
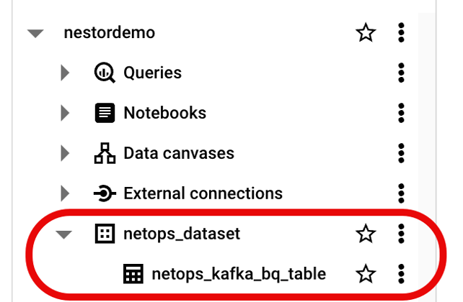
Figure 3: BigQuery dataset and table created for DX NetOps.
To create the BigQuery table, the first step is to define the table schema, which specifies the column names and data types. In BigQuery, a schema is simply a file that outlines these details.
There are several methods available for creating BigQuery schemas. For this pilot project, we will define the schema based on a Spectrum alarm in JSON format. Here’s how to proceed:
- Obtain a Spectrum alarm in JSON format: You can retrieve this either from the Spectrum API or directly from Kafka messages.
- Generate the schema: To do so, use this JSON schema generator or any tool of your choice. Simply paste the Spectrum alarm JSON on the left side of the tool, run the generator, and the corresponding schema will be produced on the right. Save this schema to a file (e.g.,
schema.json). - Create the BigQuery table: With the schema file ready, you can create the BigQuery table using the following command in the Cloud Shell Terminal:
bq mk --table netops_dataset.netops_table_alarm schema.json
Here, ”netops_dataset” is the BigQuery dataset, ”netops_table_alarm” is the BigQuery table, and ”schema.json” is the schema file generated in the previous step.
This process ensures that your DX NetOps alarms are stored in a structured format, making them easier to query and analyze within BigQuery.
Your table definition should resemble the example provided below:
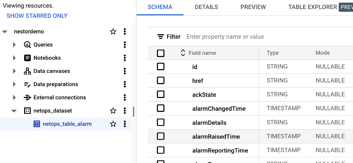
Figure 4: Table schema definition in BigQuery.
When considering Google Cloud costs, it's essential to regularly review your Google Cloud Platform pricing details to stay informed. BigQuery offers generous free usage limits: The first 10 GB of data storage and the first 1 TB of processed query data per month come at no cost. This allowance makes it possible to conduct this small-scale pilot without incurring any charges, ensuring you can explore the solution's potential without financial risk.
Step 3: Connect Kafka and BigQuery using the Pub/Sub Kafka connector
At this stage, we've successfully set up our DX NetOps alarms within the Kafka cluster and prepared our BigQuery dataset and table. The next step is to connect these two systems, enabling seamless data flow from Kafka to BigQuery.
Create a Google Pub/Sub topic
In Google Cloud Platform, the next step is to create a Pub/Sub topic along with a subscription. This can be done in a single step, as illustrated in Figure 5.
The Pub/Sub topic acts as the entry point for our data into Google Cloud, serving as the bridge between your Kafka data stream and BigQuery. The subscription functions as the mechanism that Google Cloud uses to route data from the Pub/Sub topic to BigQuery, essentially acting like a message bus that ensures the data is delivered accurately and efficiently.
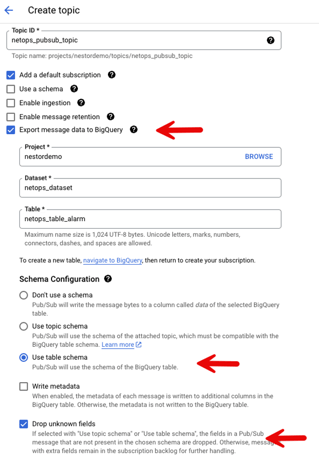
Figure 5: Topic configuration in BigQuery.
Important considerations when creating the Pub/Sub topic:
- Select "Export message data to BigQuery:" This option ensures that the data flows from Pub/Sub to the BigQuery table we created in step #2.
- Select "Use table schema:" Make sure to choose this option to leverage the schema that was used to create the BigQuery table, ensuring consistency in the data structure.
- Select "Drop unknown fields:" Enable this option to ensure that all DX NetOps alarms are stored in the BigQuery table, even if they contain additional fields not defined in the schema.
- Assign the BigQuery Data Editor role: This is crucial—ensure that the Service Account used by Pub/Sub is assigned the BigQuery Data Editor role. Without this permission, the Pub/Sub service account will not have the necessary privileges to write data to the BigQuery table.
Connect Apache Kafka to Pub/Sub
Now that we have our Pub/Sub topic set up, the next step is to stream DX NetOps alarms from Apache Kafka to this Pub/Sub topic. To achieve this, we’ll use the Pub/Sub Kafka Connector, which acts as a Kafka consumer, reading alarms from the specified DX NetOps Kafka topic and forwarding them to the Pub/Sub topic.
There are two key configuration files you'll need to set up for this connector:
cps-sink-connector.properties
This file can be found in the GitHub repository of the Pub/Sub Kafka Connector.
It specifies the Kafka topic to read from, the target Google Cloud project, and the Pub/Sub topic to which the data should be sent.connect-standalone.properties
This file is located in the Kafka cluster’s file system.
It contains details about the Kafka cluster, including the connection settings, and the path to the connector.
After configuring these files, the connector will be ready to stream data from Kafka to Pub/Sub.
Finally, ensure you create a Google Service Account within your Google Cloud Platform project and assign it the Pub/Sub Admin role (Figure 6). This is necessary to grant the connector the appropriate permissions to publish messages to the Pub/Sub topic.
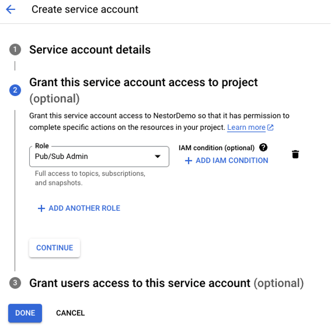
Figure 6: Google Service Account creation.
Additionally, create and download a private key for the Kafka connector (Figure 7). This key is required for the connector to authenticate and write data to the Pub/Sub topic.
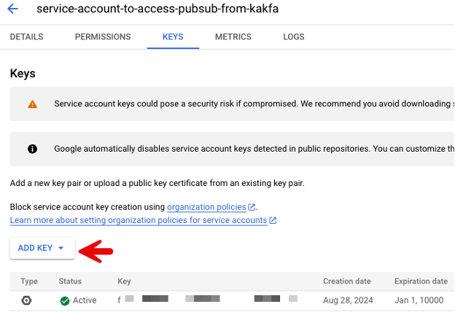
Figure 7: A key is required for the connector to authenticate.
The connector is now ready to be executed. To streamline this process, wrap the full command in a script (e.g., runconnector.sh) as shown below. Be sure to verify your file paths and execution permissions.
(Note: Ensure that the private key generated earlier is copied locally to the system, as it is required for the connector to authenticate and write to the Pub/Sub topic.)
#!/bin/bashexport GOOGLE_APPLICATION_CREDENTIALS=/root/pubsub-kafka-connector/gcp-nestor-key/opt/CA/netops-kafka/kafka/bin/connect-standalone.sh \ /root/pubsub-kafka-connector/config/connect-standalone.properties \/root/pubsub-kafka-connector/config/cps-sink-connector.properties
Once the script is set up, run the connector. You should see it begin to consume messages from Kafka and forward them to Pub/Sub. Subsequently, Pub/Sub will utilize the BigQuery subscription to populate the table we created in BigQuery.
To verify that the DX NetOps alarms are being correctly stored in BigQuery (Figure 8), you can use a query such as:
“SELECT * FROM `nestordemo.netops_dataset.netops_table_alarm`”

Figure 8: Verifying alarms are actually streamed into BigQuery.
Step 4: Visualize network insights in Looker Studio
Now that our data pipeline is complete, we can move on to visualizing DX NetOps insights in Looker Studio.
Start by configuring a new data source within Looker Studio (Figure 9). Choose BigQuery as the data source type to connect directly to the BigQuery dataset that stores the DX NetOps alarms.
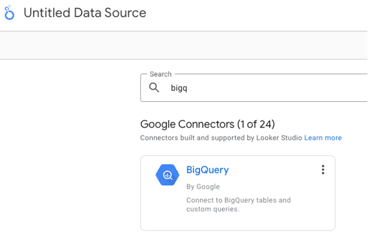
Figure 9: Data source creation in Looker Studio.
Next, create a new report and select the BigQuery data source you just configured. With the data source set up, you can begin enhancing your report by adding various charts and visualizations. This will allow you to effectively showcase network insights, calculated fields, and key performance indicators (KPIs). These views are derived from the raw data that has been ingested into Google Cloud through the streaming data pipeline. Looker Studio’s visualization tools transform your streaming data into dashboards and reports that provide actionable information (Figure 11).
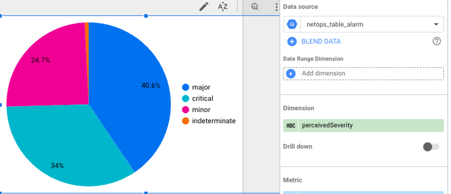
Figure 10: Customization of visualizations in Looker Studio.
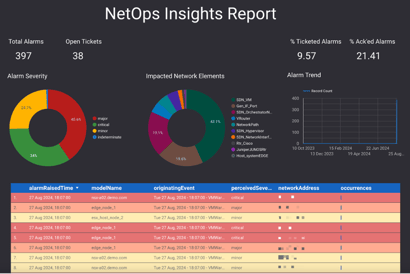
Figure 11: Sample report generated by Looker Studio.
Drawing it all together
This tutorial has guided you through the process of streaming and visualizing DX NetOps insights in BigQuery. By implementing real-time data pipelines like these, network operations teams can leverage the automation and integration capabilities that fuel enhanced insights and efficiency.
Once your data is stored in Google Cloud, there are numerous exciting opportunities to explore, such as leveraging Gemini AI for advanced data analysis—but that will be a topic covered in a future blog post.
To learn more about how DX NetOps by Broadcom collects and analyzes network data at scale, visit our Network Observability microsite.
Tag(s):
DX NetOps
,
Network Monitoring
,
Network Observability
,
Network Management
,
Kafka
,
BigQuery

Nestor Falcon Gonzalez
Nestor holds a Master's Degree in Telecommunication Engineering and has over 20 years of experience in Telco, Network and Infrastructure Operations in different roles: SWAT, pre-sales and Solution Architect. He focuses on helping customers on their network transformation, driving innovation and providing value for...
Other resources you might be interested in
Automic Automation Cloud Integration: DBT
This video explains the Automic Automation DBT agent integration and its benefits. Learn about the agent and find out how to install, configure, and use it.
Automic Automation Cloud Integrations: Cloud Foundry Agent Integration
This video explains the Automic Automation Cloud Foundry agent integration and its benefits. Learn how to install, configure, and use the agent.
Rally Office Hours: April 30, 2026
This Rally office hours video covers a new milestone delivery confidence framework, user Q&A on features like ranking, and upcoming event news.
Clarity: Objects, Attributes, and Views
In this course, you will master the five core functional areas of Clarity Admin Studio configuration that form the backbone of the user experience.
Enabling Secure HTTPS Communication with TLS Encryption for AutoSys Components
Workload Automation Administrators can gain essential knowledge on enabling secured HTTPS communication between AutoSys components using TLS encryption.
Automic Automation: Getting Started with the Automic Web Interface Version 26
Get started with the v26 Automic Web Interface (AWI). Learn how to navigate the modernized UI, customize your workspace, and move between perspectives.
Automic Automation v26: Zero Downtime Upgrade (ZDU)
Learn how to employ the Zero Downtime Upgrade (ZDU) process. Transition from Automic v24 to v26 while your mission-critical workflows continue to execute.
Rally Office Hours: April 23, 2026
Learn about new tools Rally provides for moving legacy pages to custom views. Listen to technical Q&A and find out about upcoming events.
ValueOps ConnectALL: Synchronize Jira and Rally for Frictionless Cost Accounting
This course teaches you how to integrate Jira data into Rally for the purpose of frictionless cost accounting in Clarity.