If you manage a network, every network device generates a large volume of logs. These logs are extremely important and narrate a story about both events and the sequencing of those events within your network. This capability is critical for any network monitoring software, helping you easily understand network activities, user actions, security breaches, and much more. Advanced log monitoring solutions should enable centralized collection and management of these logs, along with detection of abnormalities like error codes, device malfunctions, login issues, or potential external security threats.
Today’s enterprise uses network infrastructure that spans outside of secured data centers. Increased adoption of cloud, SD-WAN, and “work from anywhere” use cases have instantly increased the number of access points and endpoints, leading to a rapid growth in event log data. Recent network outages in 2021 demand a continued need for configuration change management via log analysis. By now, every organization should understand the importance of network logs; additionally, they should utilize more than one siloed log analytics tool or manually investigate device logs during triage.
Many tools lack synergy between existing network monitoring software programs, which typically come from different vendors or require manual workflow and expertise to locate the right set of logs. As a result, organizations lack “complete” visibility of logs in context with alarms, fault, performance, flows, and configuration to improve triage accuracy and time.
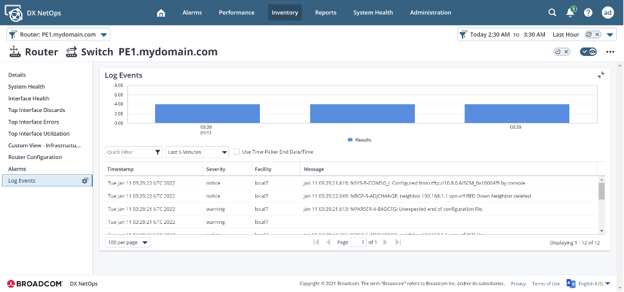
Figure 1: Reduce MTTR through contextual log visualization
Introducing DX NetOps Insights for Advanced Log Analysis
DX NetOps Insights network monitoring software helps you collect, visualize, and centrally manage all your network infrastructure logs with our cloud-based aggregation and analytics service. The solution correlates your collected network logs with monitoring data that can be either inventory- or alert-based, while enabling easy inspection of this data for millions of log lines with one click within the NetOps portal.
DX NetOps Insights also helps you proactively monitor logs for interesting critical patterns, generating events or alerts with further integration to notification systems (traps, email, script, ticketing). Contextually-correlated workflows allow for quicker triage and thereby reduce resolution time from hours to minutes.
By default, syslog (rsyslog) on Linux systems can be used to forward logs to our SaaS-based DX NetOps Insights log analytics cluster-hosted engine, and then surface them on demand within DX NetOps. Through our network monitoring software’s embedded analytics, you can easily visualize logs in context to network faults for the affected network device.
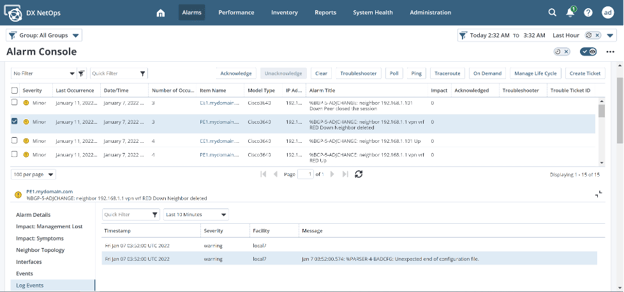
Figure 2: Gain log insights in-context to network faults for any network infrastructure
Key Highlights
Simplify log management with centralized storage in a highly scalable, managed SaaS service
DX NetOps Insights enables you to centrally manage your logs using our cloud-based aggregation and analytics service. You can easily send your network syslogs to our log insights engine by simply installing a Log Collector, a lightweight connector sitting within your data center that relays logs in a safe and secure mode to the DX NetOps Insights log cluster in SaaS.
Analyze logs contextually for faster issue resolution
DX NetOps Insights helps correlate the right set of logs contextually with the monitored device and alert for fast troubleshooting. You can search through large volumes of logs and correlate events across your environment quickly. It also helps you proactively monitor logs for interesting critical patterns or anomalies and enables quicker triage, thereby reducing resolution time from hours to minutes. The solution also offers a Kibana interface on top of the log cluster for even more historical log forensics and analysis.
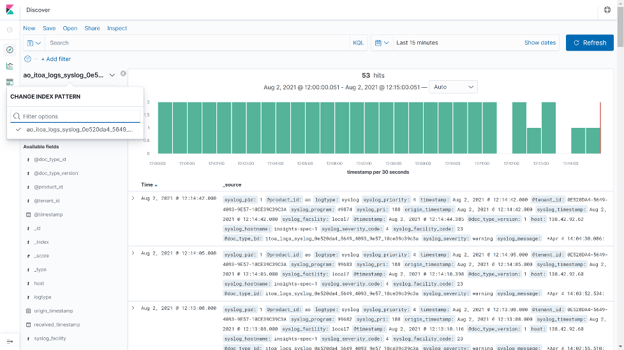
Figure 3: Kibana interface on log cluster for historical forensic of logs
Notification system integration for seamless troubleshooting
DX NetOps Insights offers out-of-the-box dashboards to quickly start monitoring key performance metrics. It also allows you to share dashboards with teams for review and troubleshooting. With DX NetOps Insights network monitoring software, advanced log analytics is an integral part of the unified NetOps portal and helps you leverage all integration channels like scripts, email, trap, and ticketing for log events and alerts.
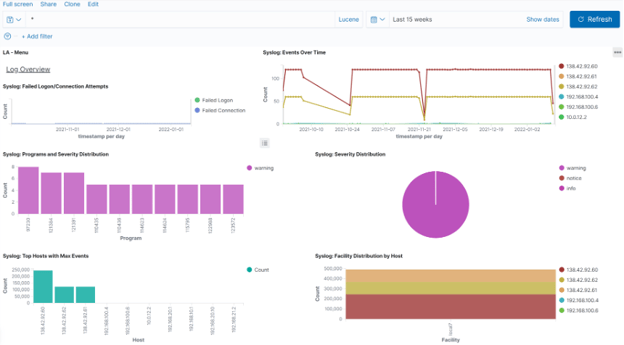
Figure 4: Preconfigured dashboard to monitor log trends and anomalies
DX NetOps Insights offers an out-of-the-box log consumption dashboard, which helps you better plan and control your log ingestion and get a real-time view of the volume of logs getting ingested and processed per day. This feature enables a better understanding of when you are going to hit your ingestion throttling limits by delivering full visibility of the log volume being generated by your organization and storage consumption upfront for better planning and management.
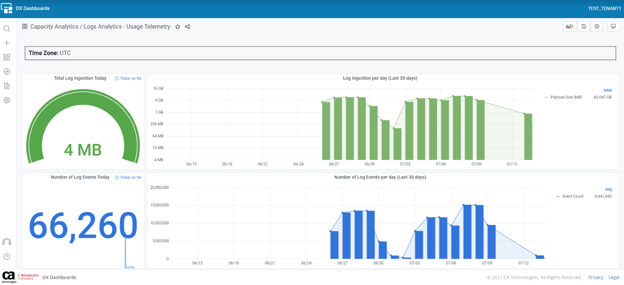
Figure 5: Log consumption dashboard for easy visibility into limits about to be breached.
Conclusion
World-class network visibility means painting a complete monitoring picture of network performance. DX NetOps Insights network monitoring software from Broadcom Software enables IT operations teams to collect and analyze every metric important to resilient network delivery. This allows organizations to make intelligent decisions about the root cause of any performance issue related to a specific device, interface, or virtual network function.

Sandeep Tiwary
Sandeep Tiwary is a product manager for network operational intelligence for AIOps solutions at Broadcom. He has a deep understanding of and expertise in cloud technologies, along with more than 16 years of experience building and marketing software products and services. He is currently driving customer-centric...
Other resources you might be interested in
Network Observability NCM
See how Network Observability NCM delivers network configuration management capabilities that automate remediation, ensure compliance, and mitigate risk.
Rally Office Hours: July 2, 2026
Explore the July 2, 2026, Rally Office Hours session covering OAuth security updates, the new portfolio item flow states beta, and upcoming event news.
Unleashing Enterprise Agility: The Power of Portfolio Kanban Flow States
Learn how Rally's Customizable Portfolio Item Flow States (PIFS) balance team autonomy with executive visibility to accelerate enterprise value delivery.
Chart Your Team’s Analytics Journey with Customizable Dashboards in DX NetOps
DX NetOps now features customizable dashboards, providing standards-based flexibility and an easy way for new and existing users to add custom dashboards.
What’s New in Network Observability for Summer 2026
Find out about the updates coming to Network Observability by Broadcom. See how you can reduce alert fatigue, automate compliance, and simplify management.
Rally Office Hours: June 25, 2026
Explore product tips, including AI-driven story creation, and stay updated on the latest Rally news and upcoming collaborative events for July and August.
Rally Office Hours: June 18, 2026
This session covers new in-app notifications, OAuth security updates, technical Q&A on widgets, and upcoming product roadmap sessions for the community.
Clarity Roadmaps: From Strategy to Execution
Learn how to use Clarity roadmaps to connect investments, timelines, financials, and delivery commitments in a single view.
Rally Office Hours: June 11, 2026
Watch the June 11, 2026, Rally Office Hours for updates on Academy resources, custom page migration goals, AI documentation, and upcoming Q3 roadmap news.