|
Key Takeaways
|
|
Why end-to-end web app monitoring matters
These days, maintaining uptime of your servers and other infrastructure elements remains as critical as ever—but it’s not enough. Quite simply, even the best server reliability metrics won’t mean a thing if the user experience is poor.
What truly matters is understanding the service levels your users experience, whether they’re accessing apps through a web browser or interacting with API-based services.
To deliver the reliability and speed that modern businesses demand, you need more than basic monitoring—you need proactive insight into every step of the user journey. This is where advanced products like AppNeta by Broadcom step in.
Introducing AppNeta: Simulating real user interactions
Today, AppNeta offers end-to-end monitoring coverage that delivers the crucial insights teams need to truly understand what the end-user experience is really like. AppNeta simulates user and client interactions. How does it do this? With workflows—automated scripts that mimic actual user behaviors. These scripts run from Monitoring Points, agents that run in the same locations as your users. This means you don’t have to guess what your users are experiencing—you see for yourself.
Here’s how AppNeta works
AppNeta runs synthetic transactions using Selenium, replicating user interactions, such as logging in, clicking around, and performing tasks. It follows multi-step interactions—called “milestones”—and tracks the timing of each of these steps. You can set up Monitoring Points in your own environment or use ones Broadcom has set up in the cloud.
Why this beats waiting for support tickets
Lacking end-to-end visibility, many teams are stuck reacting to complaints and tickets of end users, which poses a range of disadvantages:
- Inconsistent and slow. The reality is that people don’t always report problems right away, if at all. Maybe they wait it out, move on to another task, or spend time checking to see if colleagues are seeing the same thing.
- Reactive. By the time the help desk gets involved, the service levels of many of your users might already be suffering.
- Time consuming, inefficient. When users do submit a ticket, they may not provide much detail. That leaves operations teams scrambling to get basic questions answered so they can start triaging. Teams may have to figure out where users are located, what path their interactions are taking, and more before they can start troubleshooting.
By contrast, with AppNeta, your teams get notified sooner and they get more detail. Here are just a few of the key advantages the product provides:
- Gain proactive, preemptive insights. You can have alerts generated when performance dips below an acceptable level, rather than waiting for a user to encounter an issue and submit a trouble ticket.
- Establish holistic visibility. With the product’s end-to-end visibility, your teams can quickly determine if an issue is user specific, network domain specific, or app specific.
- Track trends. AppNeta runs tests at consistent intervals. This consistent monitoring yields timely insights and visibility into how performance is trending over time.
- Prioritize what matters. With AppNeta, you can target important apps that matter most to the business, making specific calls to APIs and services.
Target these workflows: browser and HTTP
AppNeta supports two main types of workflows—browser and HTTP. Each comes with its own set of charts and tests to help you zero in on what matters. Here’s more information on each:
- Browser workflows. These simulate how users interact with web pages. You get charts for transaction times, page load times, server response times, downloads, DNS, and even Apdex scores (which show how happy or frustrated users are with response speed).
- HTTP workflows. These track how APIs or web services respond to direct HTTP requests, making them ideal for apps that talk to APIs behind the scenes. You can monitor server response times, retransmissions, downloads, and DNS. In addition, you can receive alerts if performance slips below your established thresholds.
Dashboards in action: some real-world examples
Imagine starting your work day by logging in and seeing a dashboard that shows all the web apps you’re responsible for—with availability stats across multiple timeframes.
You can check alerts for data loss and jitter, and dive into breakdowns for multi-step workflows. Here are a couple examples of the types of visibility you get:
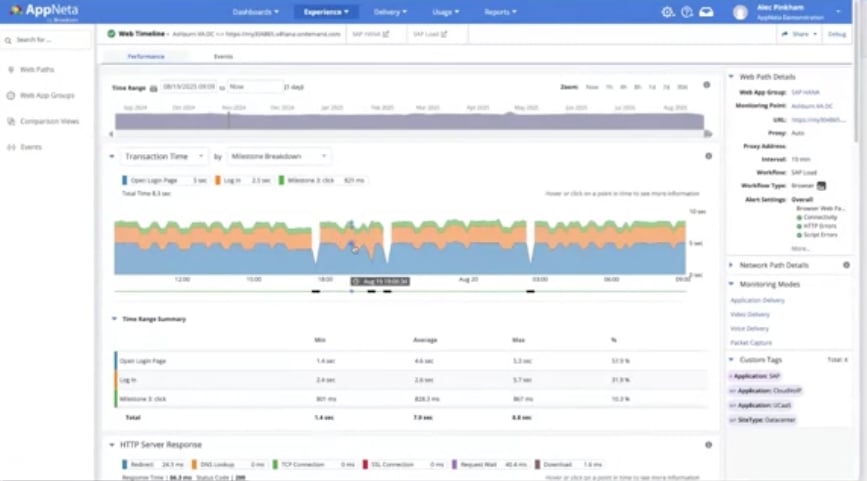
Example browser-based workflow: SAP Hana dashboard
If you’re running SAP apps, you can have a workflow targeting an SAP Hana dashboard. You can see a complete browser-based workflow, and view transaction times, HTTP server responses, SSL requests, download speeds, and more. All the nitty-gritty details are there to help you spot—and fix—problems fast.
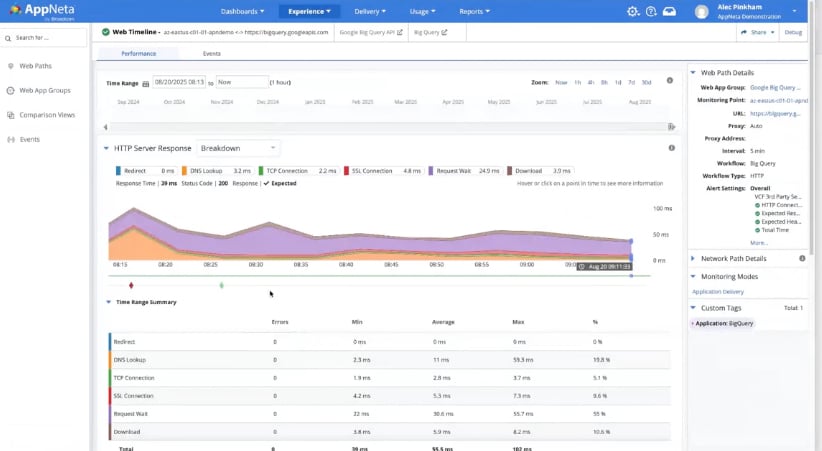
Example HTTP-based workflow: Google BigQuery
Want to track an API endpoint, like Google BigQuery? AppNeta lets you drill down into HTTP server response times, spot threshold violations, and see if issues clear up quickly or linger. You can even trace the exact network path and monitoring point that was used, so you know exactly where the bottleneck is. For a specific route, you can see details on capacity, data loss, jitter, latency, and round-trip response time.
The bottom line
AppNeta’s browser- and HTTP-based workflows go way beyond device uptime—they let you see what users actually experience. With the product, you can preempt issues and solve problems before they become headaches for your end users. If you’re ready to stop reacting and start proactively supporting your users, it’s time to check out what AppNeta can do for you.
To learn more and see a demonstration of the solution, be sure to view our recent Small Bytes webcast, “Beyond Uptime: End-to-End Web App Monitoring with AppNeta.”

Alec Pinkham
Alec is a Product Marketing Manager for the AppNeta solution at Broadcom. He spent seven years with AppNeta in the Application and Network Performance Monitoring space before joining Broadcom. Prior to AppNeta his background is in software product management in HMI/SCADA solutions for industrial automation as well as...
Other resources you might be interested in
Controlling Flow Telemetry Overhead in Distributed Environments
See how the latest updates to NetOps Flow reduce telemetry overhead and optimize WAN usage. Simplify data extraction and integration with the OData 4 API.
Clarity: Managing Reports
This course is designed for report consumers who need to access, analyze, and manage published reports in Clarity.
Automic Integration Brochure
This brochure serves as your guide to the diverse tools, platforms, and systems that can connect seamlessly with Automic.
Clarity: Configure Reporting Data Sources Using Data Providers
This course explains the data foundation that supports Reporting in Clarity. Learn how Data Providers prepare, organize, secure, and validate reporting data.
Rally Office Hours: July 9, 2026
This session covers the general availability of milestone delivery confidence, troubleshooting for custom views and admin functions, and upcoming webinars.
Network Observability NCM
See how Network Observability NCM delivers network configuration management capabilities that automate remediation, ensure compliance, and mitigate risk.
Rally Office Hours: July 2, 2026
Explore the July 2, 2026, Rally Office Hours session covering OAuth security updates, the new portfolio item flow states beta, and upcoming event news.
Unleashing Enterprise Agility: The Power of Portfolio Kanban Flow States
Learn how Rally's Customizable Portfolio Item Flow States (PIFS) balance team autonomy with executive visibility to accelerate enterprise value delivery.
Chart Your Team’s Analytics Journey with Customizable Dashboards in DX NetOps
DX NetOps now features customizable dashboards, providing standards-based flexibility and an easy way for new and existing users to add custom dashboards.