|
Key Takeaways
|
|
End blind spots in your network
Network operations teams are under constant pressure to ensure optimal performance and availability. But in today's complex network environments, gaining a clear picture of what's happening is difficult. Without a reliable method of collecting performance metrics across your most critical connections, identifying the root cause of slowdowns or outages becomes a frustrating and time-consuming process.
AppNeta by Broadcom has been bringing active network performance monitoring to the market for many years. The solution relies on the base-level protocols of ICMP, TCP, and UDP because they are ubiquitous, trusted, and generally responsive. ICMP-based active network monitoring, while still valuable today for route determination, can fall short due to the increasing prevalence of firewalls, security proxies, and content inspection services. These security measures, designed to protect networks, frequently block or throttle ICMP traffic. To avoid gaps in their monitoring coverage, teams need to do additional configuration to create workarounds. This leads to incomplete performance insights, inaccurate assessments of network health, and ultimately, difficulty troubleshooting issues when they inevitably arise.
Introducing TCP monitoring
We're thrilled to announce the arrival of a solution designed to address these critical monitoring challenges: TCP-based active monitoring. This powerful new feature leverages the TCP protocol, the same protocol used for most web traffic, to provide a significantly more reliable and accurate view of the performance of your network delivery paths. By using TCP packets for monitoring, we bypass many of the restrictions imposed by modern security infrastructure, ensuring consistent data collection, even in complex environments. This means you gain access to more complete and reliable performance data, leading to more accurate insights and faster troubleshooting. With TCP monitoring, you can finally see the full picture of your network's health, identify bottlenecks with precision, and ensure optimal performance of your critical applications and services.
TCP monitoring offers several key advantages over traditional ICMP-based methods:
- Unwavering reliability: Unlike ICMP, which is frequently blocked by security devices, TCP monitoring uses port 443, the standard port for HTTPS traffic. This means your monitoring data can reliably traverse firewalls and security proxies, providing consistent insights even in heavily secured environments. Imagine trying to monitor the performance of a cloud application hosted behind a strict firewall. ICMP monitoring might fail to penetrate these defenses, leaving you blind to potential performance issues. TCP monitoring, however, seamlessly bypasses these restrictions, delivering the data you need.
- Real-world accuracy: TCP monitoring mirrors the behavior of your actual web traffic, providing more relevant performance insights. Because TCP is subject to the same network conditions as your users' web requests, including multipath routing technologies, the data collected reflects the true end-user experience. This level of accuracy is crucial for understanding and optimizing application performance.
In the example below, ICMP is used to target an external app and reports 0% Data Loss.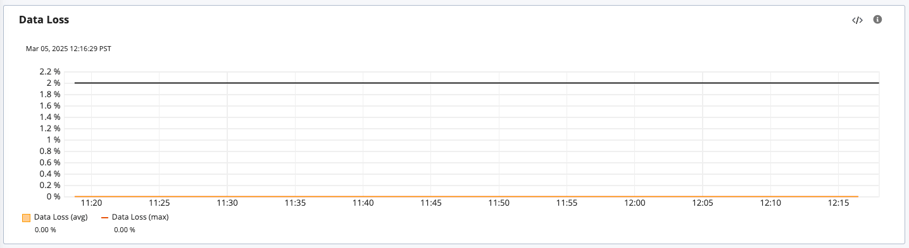
While testing with TCP data loss is observed due to TCP port starvation in the building’s egress router.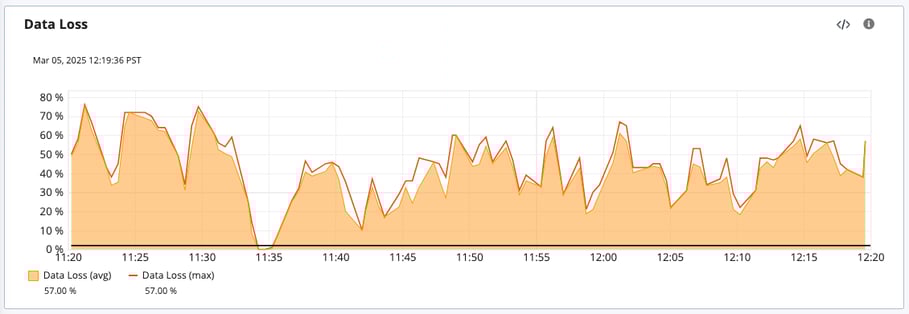
- Effortless deployment: Leveraging the commonly open port 443 significantly reduces the need for firewall changes. This simplifies deployment, minimizes administrative overhead, and accelerates time-to-value. No more complex firewall rule configurations or lengthy approval processes—TCP monitoring gets you up and running quickly.
- Streamlined troubleshooting: Armed with more accurate and reliable performance data, you can pinpoint the root cause of network issues faster and more efficiently. No more guesswork or chasing phantom problems. TCP monitoring empowers you to identify and resolve performance bottlenecks with precision, minimizing downtime and maximizing user satisfaction.
While some other monitoring solutions offer TCP-based monitoring, AppNeta's implementation provides a significant advantage. AppNeta’s TCP monitoring goes much deeper than traditional approaches, providing granular performance data, including useful metrics like jitter and packet loss. In addition, the solution provides detailed traceroute information, which includes recent updates for parallel execution on AppNeta Monitoring Points. Our intuitive visualizations make it easy to understand complex network behavior, while seamless integration with other Broadcom monitoring solutions offers a holistic view of your entire IT infrastructure. This comprehensive approach gives you the context and insights needed to optimize network performance and ensure a superior user experience.
We encourage readers to learn more about TCP monitoring through the AppNeta Documentation. If you’re interested in discussing how this upgrade could help your organization, contact your Broadcom representative. Set up some time to explore everything you can do with TCP monitoring.
Tag(s):
AppNeta
,
Network Monitoring
,
Network Observability
,
Network Management
,
TCP
,
TCP Monitoring

Sarbdeep Singh
Sarbdeep Singh holds the position of product manager for the network operational intelligence team. Bringing over 16 years of expertise in the network/system management domain, he adeptly navigates the intricate landscape of NetOps solutions, enhancing overall efficiency and performance.
Other resources you might be interested in
What’s New in DX NetOps Topology: Summer 2026
See what’s new in DX NetOps topology. Leverage capabilities for expanded multi-vendor discovery, faster triage, custom views, and seamless data exports.
Rally Office Hours: July 23, 2026
Watch the Rally Office Hours from July 23, 2026, featuring updates on custom page migration, governance work rules tips, and upcoming widget releases.
Rally Office Hours: July 16, 2026
This July 16, 2026 Rally Office Hours session highlights a new custom pages substitution variable, custom page migration updates, and community Q&A.
Controlling Flow Telemetry Overhead in Distributed Environments
See how the latest updates to NetOps Flow reduce telemetry overhead and optimize WAN usage. Simplify data extraction and integration with the OData 4 API.
Clarity: Managing Reports
This course is designed for report consumers who need to access, analyze, and manage published reports in Clarity.
Automic Integration Brochure
This brochure serves as your guide to the diverse tools, platforms, and systems that can connect seamlessly with Automic.
Clarity: Configure Reporting Data Sources Using Data Providers
This course explains the data foundation that supports Reporting in Clarity. Learn how Data Providers prepare, organize, secure, and validate reporting data.
Rally Office Hours: July 9, 2026
This session covers the general availability of milestone delivery confidence, troubleshooting for custom views and admin functions, and upcoming webinars.
Network Observability NCM
See how Network Observability NCM delivers network configuration management capabilities that automate remediation, ensure compliance, and mitigate risk.