With Experience-Driven NetOps, it's now possible to have user experience, active testing, and network path analytics in the NOC for any managed or unmanaged network
We all know that cloud and SaaS adoption continues to grow rapidly, often outpacing budgets. In fact, spending on IaaS and SaaS exceeded budgets in more than 40% of organizations in 2021. As a result, network traffic is now spending much more time on the internet than in our own data centers. The internet has become the new enterprise network.
So if enterprises are heavily investing in these services and moving resources out of the data center, how do you actually ensure these services deliver on their full potential? How do you make sure these services heighten—not hinder—your ability to do in depth, end-to-end monitoring? How do you ensure that your NetOps teams and their monitoring tools work effectively in a cloud- and SaaS-first networked world?
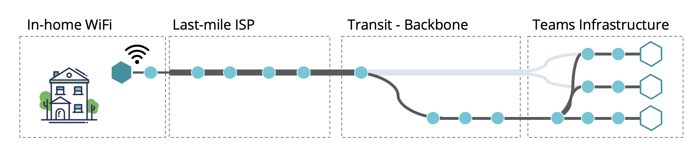
Figure 1: Cloud and SaaS adoption is creating a new enterprise network that network teams are now responsible for.
This latest release of DX NetOps, our award-winning network monitoring software, is transforming Network Operations Center (NOC) triage and response times. It brings user experience to the forefront of NOC visibility across traditional and SDx networks, on-premise or in the cloud, and across the WAN into ISP networks.
DX NetOps 22.2 extends your network monitoring visibility across the internet for a complete hop-by-hop picture of modern network delivery for the SaaS-based user experience, work from anywhere user experience, and hybrid-cloud user experience, along with active testing of modern network delivery before, during, and after deployments.
Most importantly, we are routing these user experience metrics through the NetOps standard operating procedures and workflows you have come to depend on. Backed by alarms, events, topology, performance, faults, flows, logs, configurations, and now user experience metrics from AppNeta, you yourself will still be able to triage easily, find root causes quickly, escalate to engineers or architects, open trouble tickets, or isolate and resolve network delivery issues impacting user experiences.
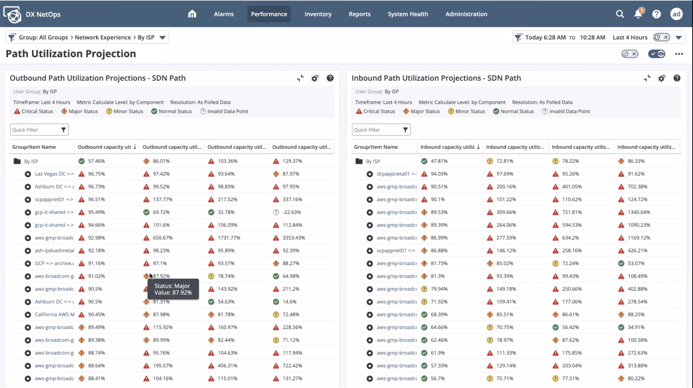
Figure 2: DX NetOps’ network path analytics visualizes critical ISP and cloud network change events and delivers pinpoint focus on what matters for fast isolation of user and service disruptions
By integrating AppNeta’s inventory, events, and performance metrics into DX NetOps, teams gain the ability to easily triage not only up/down issues, but also end-user experience issues across the entire path of network transactions. DX NetOps offers a seamless operational experience, industry best practices, and best-in-class triage and alarm correlation workflows. By leveraging these capabilities, teams can be equipped like never before to ensure resilient connectivity across all network types.
Download our white paper on Experience-Driven NetOps today to learn more.

Jeremy Rossbach
As the Chief Technical Evangelist for NetOps by Broadcom, Jeremy is passionate about meeting with customers to identify their IT operational challenges and produce solutions that fit their business and network transformation goals. Prior to joining Broadcom, he spent over 15+ years working in IT, across both public...
Other resources you might be interested in
Network Observability NCM
See how Network Observability NCM delivers network configuration management capabilities that automate remediation, ensure compliance, and mitigate risk.
Rally Office Hours: July 2, 2026
Explore the July 2, 2026, Rally Office Hours session covering OAuth security updates, the new portfolio item flow states beta, and upcoming event news.
Unleashing Enterprise Agility: The Power of Portfolio Kanban Flow States
Learn how Rally's Customizable Portfolio Item Flow States (PIFS) balance team autonomy with executive visibility to accelerate enterprise value delivery.
Chart Your Team’s Analytics Journey with Customizable Dashboards in DX NetOps
DX NetOps now features customizable dashboards, providing standards-based flexibility and an easy way for new and existing users to add custom dashboards.
What’s New in Network Observability for Summer 2026
Find out about the updates coming to Network Observability by Broadcom. See how you can reduce alert fatigue, automate compliance, and simplify management.
Rally Office Hours: June 25, 2026
Explore product tips, including AI-driven story creation, and stay updated on the latest Rally news and upcoming collaborative events for July and August.
Rally Office Hours: June 18, 2026
This session covers new in-app notifications, OAuth security updates, technical Q&A on widgets, and upcoming product roadmap sessions for the community.
Clarity Roadmaps: From Strategy to Execution
Learn how to use Clarity roadmaps to connect investments, timelines, financials, and delivery commitments in a single view.
Rally Office Hours: June 11, 2026
Watch the June 11, 2026, Rally Office Hours for updates on Academy resources, custom page migration goals, AI documentation, and upcoming Q3 roadmap news.