
As the use of SD-WAN continues to expand, benefits and challenges may seem to be proliferating in equal measure as well. In this post, we look at some of the advantages and obstacles presented by SD-WAN, and we detail how DX NetOps by Broadcom delivers the visibility teams need to monitor and manage their SD-WAN and legacy network environments.
The promise of SD-WAN
On the plus side, teams that employ SD-WAN are realizing significant advantages. They’re able to expand WAN bandwidth and achieve improved application performance across the WAN. At the same time, they’re doing so while leveraging commercially available technologies that enable improved cost efficiency.
As a result, SD-WAN helps teams be better equipped to address their organization’s demands for rapid scale and adapt to evolving hybrid work and cloud adoption realities.
The roadblocks presented by SD-WAN
While the promise of SD-WAN is real, so too are the potential roadblocks.
In SD-WAN environments, native monitoring tools can fuel explosive growth in event volumes, while leaving blind spots in visibility. These native tools only offer coverage from WAN edge to WAN edge; they don’t provide end-to-end visibility from where users connect. Also, these SD-WAN tools only provide visibility into the overlay, namely tunnel performance, but don’t provide insights into how and where the physical underlay may be impacting the overlay.
Further, when teams add these native tools to their environment, it means they have more disconnected tools to work with. This means they have to spend more time and effort to piece together the insights they need, stifling productivity and efficiency. (For more information on the challenges of SD-WAN monitoring, see my recent post, SD-WAN Monitoring: Why Edge-to-Edge Coverage Isn’t Enough.)
To combat these obstacles, while capitalizing on SD-WAN’s advantages, teams need a unified tool that can power more simplified standard operating procedures and fuel faster issue resolution.
DX NetOps delivers the coverage, visibility required
DX NetOps enables teams to eliminate the monitoring roadblocks presented by SD-WAN. DX NetOps delivers the correlated intelligence that enables teams to effectively track, manage, and optimize their SD-WAN and legacy environments.
DX NetOps enables teams to establish holistic visibility and effective baselines, so they can distinguish between optimal and suboptimal performance. In addition, with AppNeta by Broadcom, teams can gain an end-to-end understanding of network performance, no matter where users or critical business apps may be.
DX NetOps dashboards provide a unified view
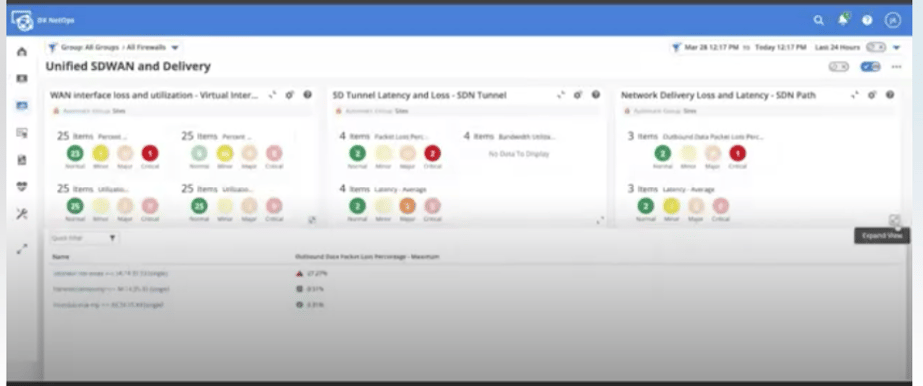
DX NetOps enables teams to gain unified views of their entire environment, from end to end. DX NetOps brings together data on SD-WAN performance, physical underlay performance, and network delivery.
Teams can build a single dashboard with information on SD-WAN tunnels, edge ports, and AppNeta network delivery paths. The solution can bring together data from a range of sources, including AppNeta, AWS, Cisco Application Centric Infrastructure (ACI), OpenStack, Versa, Viptela, and VMware.
DX NetOps enables operators to quickly get high-level, intuitive visibility of their environments. Further, DX NetOps offers users complete flexibility to customize dashboards, so they can position data where needed and align views with the context of their specific environments and objectives.
How it works
Visibility of end-to-end SD-WAN environments and experience is enabled via AppNeta paths and the concept of sites in DX NetOps.
Virtual Network Assurance (VNA) is used to collect data from SD-WAN technologies. VNA creates a user group hierarchy for each plugin instance. (For those familiar with DX NetOps, there is a consistent structure and approach across different plugins, so this SD-WAN hierarchy will resemble that of other technologies being monitored.)
Within DX NetOps, a pinning technique is used to enable the presentation of unified dashboards that reflect views of multiple technology domains.
DX NetOps incorporates all associated edge devices, and can include both primary and secondary systems. Users can look at SD-WAN devices in inventory, and view by location.
Here are some of the key elements of the environment:
- Sites. Sites are automatically created for SD-WAN and AppNeta delivery, the latter based on monitoring points and targets.
- Groups. Site groups represent source and destination targets. When communicating with controllers, DX NetOps polls edge routers. All devices can be coalesced into site groups. Group names are created automatically, but can be modified in DX NetOps.
- Geolocation. Upon device discovery, DX NetOps automatically assigns longitude and latitude. This makes it easy to group elements by region and to view devices on a map. Based on this geolocation data, teams can also add region-specific information, such as time zones, office hours, and so on.
- Folders. DX NetOps creates folders that are specific to each type of technology. These folders feature a list of monitoring points and targets and details being gathered.
Network delivery
When it comes to network delivery, DX NetOps offers a range of useful capabilities. With the solution, teams can look at outbound data packet loss, and they can view averages or maximum. One approach that we commonly see customers employ is to create views that display both averages and maximums, which is useful in tracking the high-water mark of a given device.
When users go to the VNA domain folder, they can select specific sites, which will contain all the grouped monitoring points, targets, and paths. These tech folders make it easy to drill down into all devices in a particular domain, for example, a user can filter in order to see only Viptela controllers. This visibility can provide powerful insights. For example, a user can view utilization metrics for a specific region, and quickly see metrics for a specific interface are extremely high.
Dashboard creation, customization
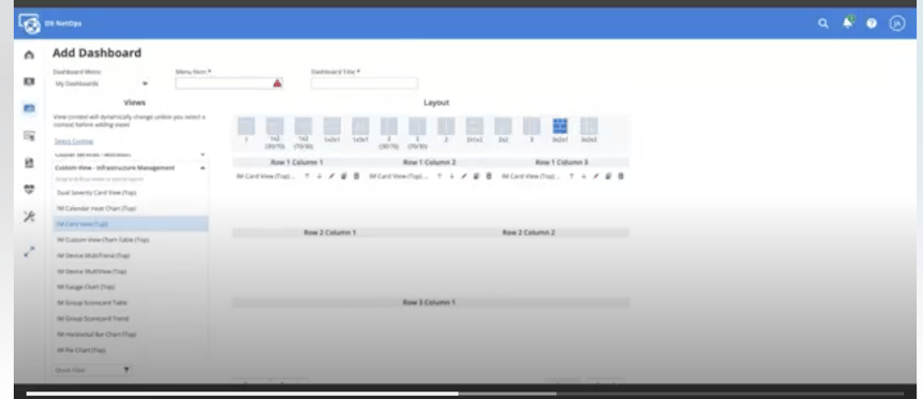
To start creating their own dashboards, users can go into the “My Dashboard” console and build and modify dashboards for their personal use. [In the future, Broadcom will make it easy to create dashboards in My Dashboard console, and share them with other teams or users. Currently, have to manually recreate or share via REST API.] For example, with DX NetOps, it is easy to build a card view that displays latency, loss, and utilization across different tiers.
In creating dashboards, users can select from different layouts. For example, a commonly used layout is one that has three card views at the top, two graphs on the second row, and a single graphic on the final row. Card views provide counts of the number of items in a group that meet specific criteria, such as exceeding a threshold.
Users can assign specific thresholds, for example, for interface utilization dashboards, they can have can thresholds set at 85% for minor, 90% for major, and 95% for critical.
Conclusion
With DX NetOps, teams can establish visibility from the edge out, not based on data from SD-WAN controllers, but from AppNeta synthetic network testing. This enables operators to validate and correlate performance issues, and spot where an issue is originating—no matter where users are located or which networks are being used.
To learn more, please see our Small Bytes webcast, How to Create Unified SD-WAN Dashboards to Understand End-to-End Experience. Also, be sure to view our Small Bytes page to see a complete list of upcoming and on-demand presentations in the series.

Jason Normandin
Jason Normandin has over 17 years of experience in the Network Performance and Fault monitoring industry. Focusing on User Experience, APIs and new technologies Jason drives to provide simplicity to complex technologies and insights into today’s massive data repositories.
Other resources you might be interested in

Going Off-Road: How We Bulletproofed Automic's Zero Downtime Upgrades
To ensure absolute reliability at SaaS scale, Automic Automation recently evolved its ZDU strategy.

Clarity: Design Visual Layouts Using Report Designer
This course teaches you how to create new reports with the Clarity Report Designer.
Rally Office Hours: September 24, 2026
Find out about a new milestone cumulative flow diagram widget and custom view widget capacity. Get tips for handling project name changes in middleware.
Rally Office Hours: September 17, 2026
Explore Rally's new delivery confidence feature for portfolio items, hear custom view migration updates, and get expert answers to Q&A.
Rally Office Hours: September 10, 2026
On the latest Rally Office Hours, learn more about new burn-down widgets, custom page migration updates, technical Q&A, and Broadcom community events.
Rally Office Hours: September 3, 2026
Review the latest Rally Office Hours summary covering the MCP Server upgrade, custom page migration updates, API tooling, Q&A, and upcoming event news.
AAI v26.0 Container Deployment
This foundational training course focuses on modernizing enterprise workload analytics across OpenShift and Kubernetes environments.

Automic Automation Cloud Integration: Workday
This video explains the Automic Automation Workday agent integration and its benefits. Find out how to install, configure, and use the agent.
Rally Office Hours: August 27, 2026
Explore key Rally updates for Kanban charts and saved views, get expert tips on milestone tracking, and sign up today for upcoming webinars on AI delivery.