|
Key Takeaways
|
|
Broadcom offers two robust solutions for network operations: DX NetOps and AppNeta. These solutions work together to provide active, passive, and infrastructure monitoring, giving you continuous, end-to-end visibility into your networks.
Our vision is to bring DX NetOps and AppNeta closer together to offer experience-driven NetOps—providing a unified solution that delivers comprehensive network visibility and network path analytics. We’ve worked toward that vision by integrating AppNeta and DX NetOps. Through this integration, you can display and analyze AppNeta data inside of DX NetOps.
Now we’re redesigning AppNeta’s interface to improve user experience and give the two products a similar look and feel. By harmonizing AppNeta’s design to be consistent with the intuitive DX NetOps interface, we will offer our customers a more seamless experience when they use these two products together.
In this blog, we’ll explore what you can expect to see in AppNeta’s new user interface design.
AppNeta's new aesthetic
We are upgrading AppNeta’s interface design to enhance the overall user experience. The updated design is clearer, more accessible, and easier to use. This interface also offers a more consistent experience when users are doing digital experience monitoring and infrastructure monitoring.
The new interface also aligns more closely with DX NetOps. The design will provide a more visually cohesive experience and facilitate seamless transitions for users of both products. The elements that we’re planning to change include:
- Colors
- Fonts
- Icons
Here’s an early look at the interface. (Note: The designs are subject to change.)
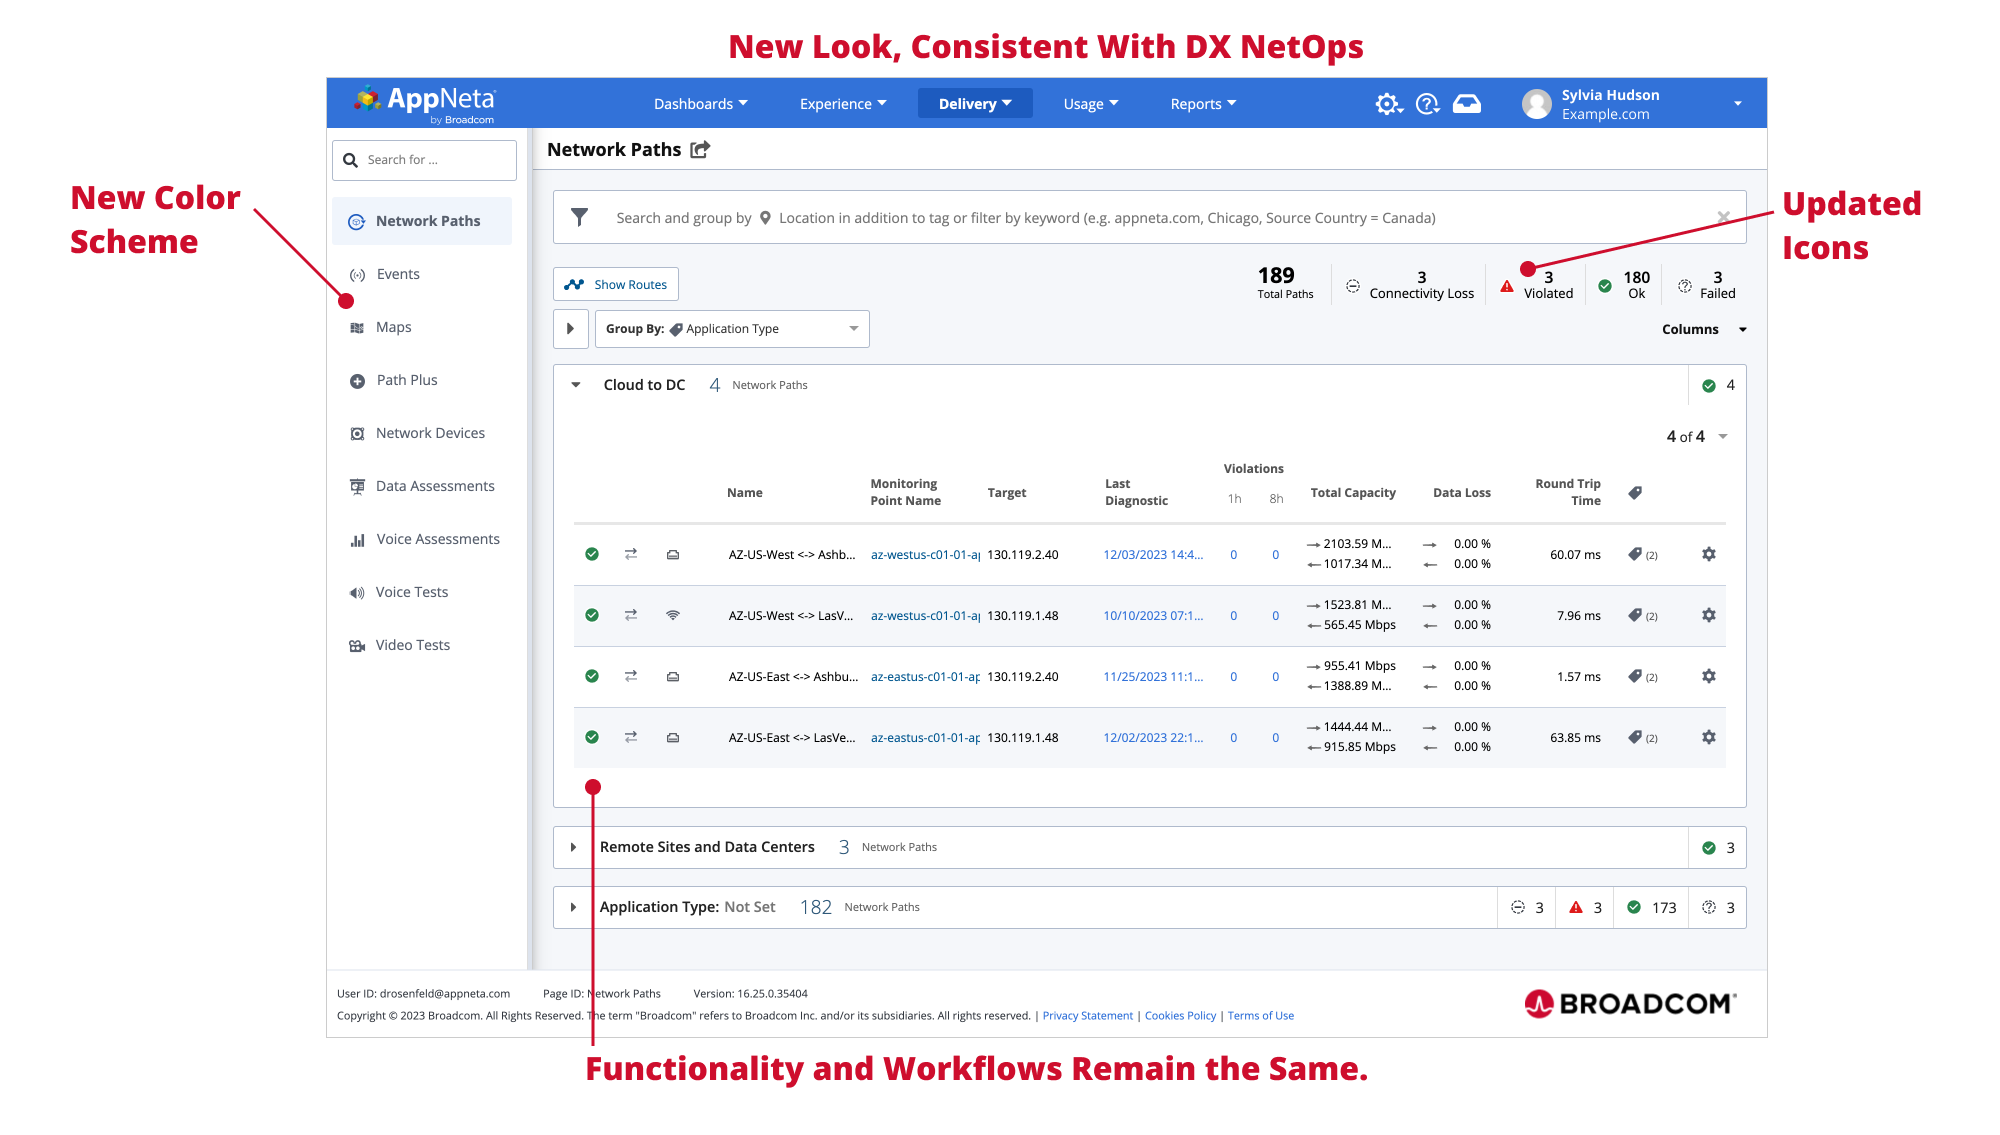
Functionality will not change
This update will preserve the existing functionality and reliability of AppNeta, with no changes to its operation. All settings and navigation will stay the same, including:
- Workflows. No alterations have been made to monitoring workflows. You will use AppNeta the same way as before.
- Configuration options. The existing configuration options will be maintained, ensuring that your customization and setup remain unchanged.
- Reports and dashboards. You will find and analyze your monitoring data in the same locations as before.
Launch timeline
We're planning to roll out the new interface in May 2024. Our team is working diligently to ensure a smooth transition, and we'll keep you updated through its launch.
Want to learn more about using AppNeta and DX NetOps together? Check out our Small Bytes session on how to use AppNeta data to create custom network delivery experience dashboards in DX NetOps.

Sarbdeep Singh
Sarbdeep Singh holds the position of product manager for the network operational intelligence team. Bringing over 16 years of expertise in the network/system management domain, he adeptly navigates the intricate landscape of NetOps solutions, enhancing overall efficiency and performance.
Other resources you might be interested in
Rally Office Hours: July 30, 2026
View this session to find out about the new query counter widget, custom list print card updates, dynamic Rally-to-Clarity mapping, and Q3 events.
What’s New in DX NetOps Topology: Summer 2026
See what’s new in DX NetOps topology. Leverage capabilities for expanded multi-vendor discovery, faster triage, custom views, and seamless data exports.
Rally Office Hours: July 23, 2026
Watch the Rally Office Hours from July 23, 2026, featuring updates on custom page migration, governance work rules tips, and upcoming widget releases.
Rally Office Hours: July 16, 2026
This July 16, 2026 Rally Office Hours session highlights a new custom pages substitution variable, custom page migration updates, and community Q&A.
Controlling Flow Telemetry Overhead in Distributed Environments
See how the latest updates to NetOps Flow reduce telemetry overhead and optimize WAN usage. Simplify data extraction and integration with the OData 4 API.
Clarity: Managing Reports
This course is designed for report consumers who need to access, analyze, and manage published reports in Clarity.
Automic Integration Brochure
This brochure serves as your guide to the diverse tools, platforms, and systems that can connect seamlessly with Automic.
Clarity: Configure Reporting Data Sources Using Data Providers
This course explains the data foundation that supports Reporting in Clarity. Learn how Data Providers prepare, organize, secure, and validate reporting data.
Rally Office Hours: July 9, 2026
This session covers the general availability of milestone delivery confidence, troubleshooting for custom views and admin functions, and upcoming webinars.