To ascertain risk, national security and intelligence professionals have long used concepts such as known knowns, known unknowns, and unknown unknowns. The idea of unknown unknowns was created in 1955 by American psychologists Joseph Luft (1916–2014) and Harrington Ingham (1916–1995). This concept continues to be used today in risk assessments and is applicable to technology.
The unknown unknowns are the threats and potential problems that remain invisible until their impact manifests. When they do, they create consequences that can disrupt the status quo.
In business, and in particular in technology, the unknown unknowns pose a serious problem and often remain elusive to IT teams. As applications have become more complex, it’s become harder to track risks. Traditional application performance monitoring (APM) has focused on monitoring for known problems. You knew the performance baseline for an application, as well as expectations and performance indicators, and you’d set thresholds and static alerts to see if performance deviates. You were monitoring for known knowns. Today, this is no longer sufficient.
APM Needs to Address the Unknown Unknowns
Modern apps are extremely complex and multi-layered. You can no longer depend on monitoring for known problems. In the cloud, the application stack is so complex that issues can happen anywhere and disrupt app performance. These app disruptions can have a negative impact on the user experience, customer/user satisfaction, and even customer retention and business revenue.
But can an APM solution really monitor for unknown unknowns?
Yes, it can and here’s how. To monitor all the layers of the environment, and understand these layers and how they interact, an APM solution needs a topology model of dynamic and constantly changing environments.
Along with a topology model, a solution must have the intelligence needed to determine when a metric deviates from norms. A solution needs to be able to correlate events and anomalies and identify probable root causes, then automatically remediate the issue. An APM solution such as Broadcom’s DX APM SaaS does this with a rich topology based on our strengths in monitoring applications, infrastructures, and networks. We have a built-in, automated remediation engine that leverages the topology and helps customers automatically remediate issues when they occur.
DX APM SaaS is capable of dynamically monitoring for unknown unknowns, enabling businesses to elevate their level of observability and create confidence that they won’t run into surprises.
What does this look like? Here’s a scenario to illustrate. In this fictional scenario, we’ll demonstrate how John, an SRE/DevOps engineer, can use our DX APM SaaS solution to query across captured instrumentation data to examine, correlate, and derive insight or uncover unknown unknowns (observability) from this data.
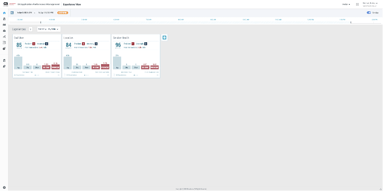
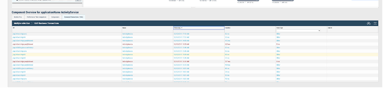
1. John is notified of a performance problem with the ACME Business Service. It appears that several users are unable to log into the site. John logs into DX APM SaaS and opens up the experience view for service health and notices that the service is indeed “Red.” Next, he drills down into service health.
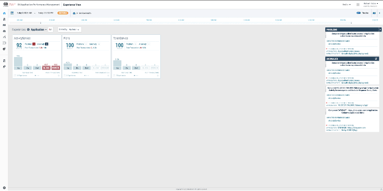
2. He sees that the activity service application is reporting a problem with several failed transactions. He sees that APM has already detected a problem and is reporting an issue with the authenticator service. He clicks on the problem to view the associated details in a problem analysis notebook view.
3. In the notebook view, John views the problem details and notices that there are issues reported with several different technology tiers of the application stack.
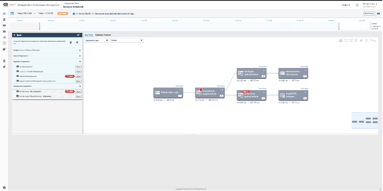
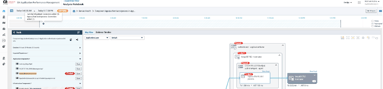
4. He notices that the system has identified the authenticator service as problematic and selects the service.
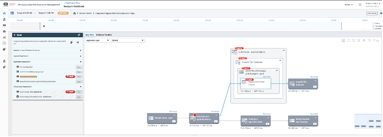
5. He opens up the traces tab to take a look at the automatically collected transactions and sees several error traces. He opens the first trace and sees that the request from the first service has timed out with a 400 error.
6. At the same time, he also observes that only some transactions are timing out while others are successful.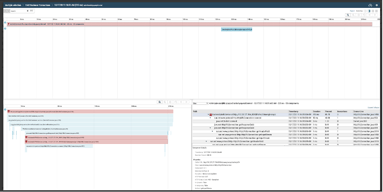
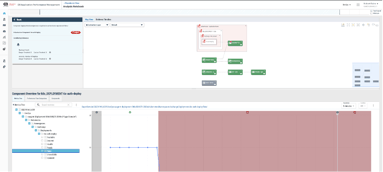
7. He wonders what could have changed with the application and brings up the timeline view to see change events. He notices a new version of the authenticator service was released to production last night. The new version was re-implemented as a microservice in a new technology stack. Furthermore, the specific team that developed the new service decided to instrument it with OpenTracing for their observability needs. Could there be an issue with the new service?
8. He turns his attention to the alarms. The system is reporting an abnormally high CPU utilization on the new service. In addition, the system has also detected a change in the deployment configuration, with the number of replicas going down from six to one. This is obviously not right: the new service was checked in with an incorrect deployment configuration. This error caused the service to be under-provisioned, resulting in performance issues.
As you can see, DX APM SaaS automatically detects issues via dynamic baselines and correlates these seemingly unrelated sets of events, both performance and change events, together in a unified topology. This helps John quickly diagnose the problem, down to the specific line of code. As a result, the solution converts unknown unknowns into known knowns.
Learn more about how DX APM SaaS can help you address unknown unknowns.

Nishant Kabra
Nishant is a Product Manager for Application Performance Management. He is passionate about releasing market-leading solutions covering full-stack observability for applications.
Other resources you might be interested in
Network Observability NCM
See how Network Observability NCM delivers network configuration management capabilities that automate remediation, ensure compliance, and mitigate risk.
Rally Office Hours: July 2, 2026
Explore the July 2, 2026, Rally Office Hours session covering OAuth security updates, the new portfolio item flow states beta, and upcoming event news.
Unleashing Enterprise Agility: The Power of Portfolio Kanban Flow States
Learn how Rally's Customizable Portfolio Item Flow States (PIFS) balance team autonomy with executive visibility to accelerate enterprise value delivery.
Chart Your Team’s Analytics Journey with Customizable Dashboards in DX NetOps
DX NetOps now features customizable dashboards, providing standards-based flexibility and an easy way for new and existing users to add custom dashboards.
What’s New in Network Observability for Summer 2026
Find out about the updates coming to Network Observability by Broadcom. See how you can reduce alert fatigue, automate compliance, and simplify management.
Rally Office Hours: June 25, 2026
Explore product tips, including AI-driven story creation, and stay updated on the latest Rally news and upcoming collaborative events for July and August.
Rally Office Hours: June 18, 2026
This session covers new in-app notifications, OAuth security updates, technical Q&A on widgets, and upcoming product roadmap sessions for the community.
Clarity Roadmaps: From Strategy to Execution
Learn how to use Clarity roadmaps to connect investments, timelines, financials, and delivery commitments in a single view.
Rally Office Hours: June 11, 2026
Watch the June 11, 2026, Rally Office Hours for updates on Academy resources, custom page migration goals, AI documentation, and upcoming Q3 roadmap news.