|
Key Takeaways
|
|
Today, network operations teams encounter significant hurdles due to shortages of skilled personnel and fragmented toolsets. Despite consolidation efforts, it's common for teams to manage up to 15 different monitoring products. Research suggests that network professionals believe they could potentially resolve 53% of network issues by implementing improved network management tools.
Since addressing service issues often requires collaboration across various teams and tools, integration becomes crucial for effectively isolating and resolving network problems. Integrated toolsets can simplify operational workflows and facilitate data sharing among operators, promoting a collaborative and standardized approach to network management.
In light of these requirements, Broadcom has enhanced its DX NetOps solution by integrating contextual syslog monitoring capabilities. This enhancement optimizes operations workflows, expedites issue triage, and streamlines the monitoring experience for NOC specialists.
What is syslog?
Syslog, which appeared in the 1980s, has emerged as a fundamental logging mechanism. Initially conceived for local logging on the Unix operating system, it swiftly evolved into a standardized protocol enabling remote logging and centralized aggregation, finding its place in networking devices and applications. Today, syslog is still a cornerstone of IT monitoring, facilitating troubleshooting and security analysis with its simplicity and interoperability.
Why use syslog in an SNMP-ruled world?
Syslog and SNMP play unique yet collaborative roles in network management. SNMP traps adhere to a structured format defined in a MIB file, offering predefined events like router interface resets. However, these traps face limitations in some scenarios, such as when application events arise or non-standardized security device messages are needed. Originally designed for application events, syslog excels in signaling alerts that arise for unpredictable reasons, making it ideal for conveying varied alert conditions. While SNMP remains a go-to for predefined events, syslog's flexibility shines in scenarios demanding reporting on dynamic, unpredictable events.
Network operations teams need efficient access to syslog
Efficient triaging of issues is paramount to maintaining reliable network operations and minimizing downtime. Syslog plays a pivotal role in this process by providing centralized logging that offers insights into network devices, systems, applications, and security events. However, the traditional workflow is cumbersome, involving manual searches and context-switching between disparate tools. This inefficiency leads to delayed response times and increased operational costs. Network teams often need easier access to relevant syslog events while troubleshooting network issues.
Integrating contextual syslog data within DX NetOps
The DX NetOps Portal seamlessly integrates with Splunk and Elastic. The solution significantly boosts NOC efficiency by automating the retrieval of relevant syslog data, and doing so within the context of alarms or network devices. This integration empowers level one and level two operators to access syslog insights, alongside performance metrics, flow data, and user experience information. This eliminates the need for teams to use multiple tools and do manual interventions.
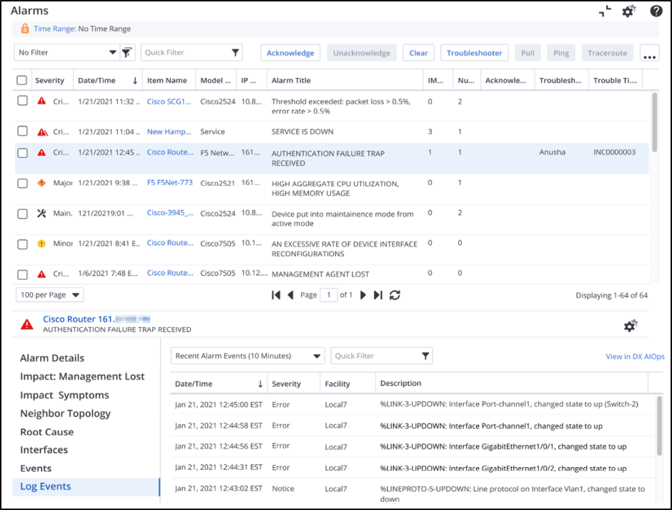
DX NetOps displays syslog entries in the context of an alarm.
When operators triage issues through the DX NetOps Portal’s alarms view, the integration automatically retrieves syslog data from log management servers, based on the alarm’s occurrence time and the device of interest. The solution’s optional filtering capabilities enable teams to do refined searches based on specific message patterns. To support troubleshooting of specific devices, the solution’s integration enables efficient fetching of syslog data for designated timeframes and presents the logs directly on the device’s context page.
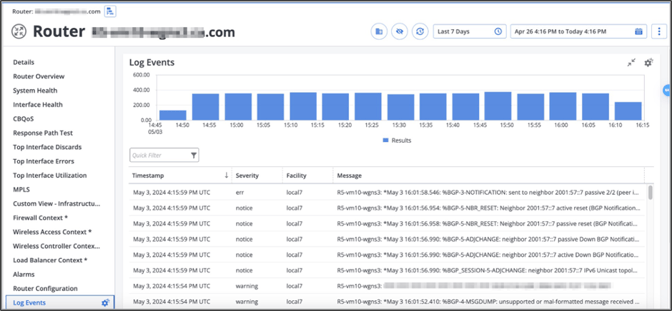
DX NetOps displays syslog entries in the context of a network device.
With the DX NetOps syslog integration, teams can leverage existing investments in Splunk and Elastic, while reducing manual efforts, streamlining time-consuming activities, and enhancing collaboration within the NOC. By facilitating rapid identification of network problems, the solution has enabled early adopters to achieve a five-fold improvement in mean time to triage. Ultimately, streamlined and automated processes reduce the learning curve and enable network teams to overcome challenges associated with poor syslog access, so they can improve the reliability and performance of network services.
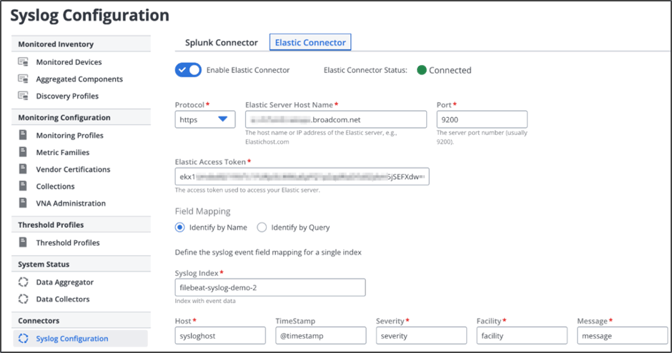
DX NetOps features a central configuration for integrating with Splunk and Elastic.
Conclusion
In the digital transformation landscape, network operations teams face a range of challenges, such as shortages of skilled personnel and issues associated with managing diverse monitoring tools. Research emphasizes the need for enhanced collaboration among teams and improved integration among disparate systems and platforms. Despite SNMP’s dominance, syslog’s flexibility remains pivotal for network observability in the NOC. Broadcom addresses these demands by adding contextual syslog monitoring capabilities to DX NetOps. This empowers teams to streamline issue triage, expedite problem resolution, and enhance overall network reliability and performance. Through its integration with Splunk and Elastic, DX NetOps combines SNMP and syslog capabilities, demonstrating Broadcom’s commitment to delivering sustained innovation to its installed base.
Existing customers can experience seamless syslog integration in DX NetOps, without any additional license cost. Simply install the latest version to unlock this feature. Also, don’t miss our complimentary Designated Weekend Upgrade Program, which helps ensure you can upgrade DX NetOps with confidence and convenience.

Abhinav Shroff
Abhinav Shroff is a Product Manager for the AIOps platform from Broadcom. He has a deep understanding and expertise in cloud technologies along with more than fourteen years of experience in building and marketing software products and services. He likes to describe himself as a product enthusiast, technologist,...
Other resources you might be interested in
What’s New in DX NetOps Topology: Summer 2026
See what’s new in DX NetOps topology. Leverage capabilities for expanded multi-vendor discovery, faster triage, custom views, and seamless data exports.
Rally Office Hours: July 23, 2026
Watch the Rally Office Hours from July 23, 2026, featuring updates on custom page migration, governance work rules tips, and upcoming widget releases.
Rally Office Hours: July 16, 2026
This July 16, 2026 Rally Office Hours session highlights a new custom pages substitution variable, custom page migration updates, and community Q&A.
Controlling Flow Telemetry Overhead in Distributed Environments
See how the latest updates to NetOps Flow reduce telemetry overhead and optimize WAN usage. Simplify data extraction and integration with the OData 4 API.
Clarity: Managing Reports
This course is designed for report consumers who need to access, analyze, and manage published reports in Clarity.
Automic Integration Brochure
This brochure serves as your guide to the diverse tools, platforms, and systems that can connect seamlessly with Automic.
Clarity: Configure Reporting Data Sources Using Data Providers
This course explains the data foundation that supports Reporting in Clarity. Learn how Data Providers prepare, organize, secure, and validate reporting data.
Rally Office Hours: July 9, 2026
This session covers the general availability of milestone delivery confidence, troubleshooting for custom views and admin functions, and upcoming webinars.
Network Observability NCM
See how Network Observability NCM delivers network configuration management capabilities that automate remediation, ensure compliance, and mitigate risk.