SAP is at the heart of many organizations’ most mission-critical business processes. If SAP systems, databases, and supporting IT infrastructure are not functioning optimally, critical business functions—such as order-to-cash or financial close—can slow down or even become completely unavailable.
SAP ERP is based on the R/3 architecture, which is a three-layer architecture. To make sure end user experience is top notch, all three layers needs to function optimally in tandem.
- Presentation layer: This layer contains the software components that make up the SAP GUI (graphical user interface). This layer is the interface between the R/3 system and its users. The R/3 system uses the SAP GUI to provide an intuitive graphical user interface for entering and displaying data. The SAP GUI can either be a thick client or a modern web-based interface. The presentation layer sends the user's input to the application server, and receives data for display from it. While a SAP GUI component is running, it remains linked to a user's terminal session in the R/3 system.
- Application layer: This layer consists of one or more application servers and a message server. Each application server contains a set of services used to run the R/3 system. Theoretically, you only need one application server to run an R/3 system. In practice, the services are distributed across more than one application server. The message server is responsible for communication between the application servers. It passes requests from one application server to another within the system. It also contains information about application server groups and the current load balancing within them. It uses this information to assign an appropriate server when a user logs onto the system.
- Database layer: This layer consists of a central database system containing all of the data in the R/3 system. The database system has two components: the database management system (DBMS) and the database itself. SAP has manufactured its own database, which is named HANA, but R/3 is compatible with all major databases, such as Oracle. All R/3 data is stored in the database. For example, the database contains the control and customizing data that determines how the R/3 system runs. It also contains the program code for applications. Applications consist of program code, screen definitions, menus, function modules, and various other components. These are stored in a special section of the database called the R/3 repository, and are accordingly called repository objects.
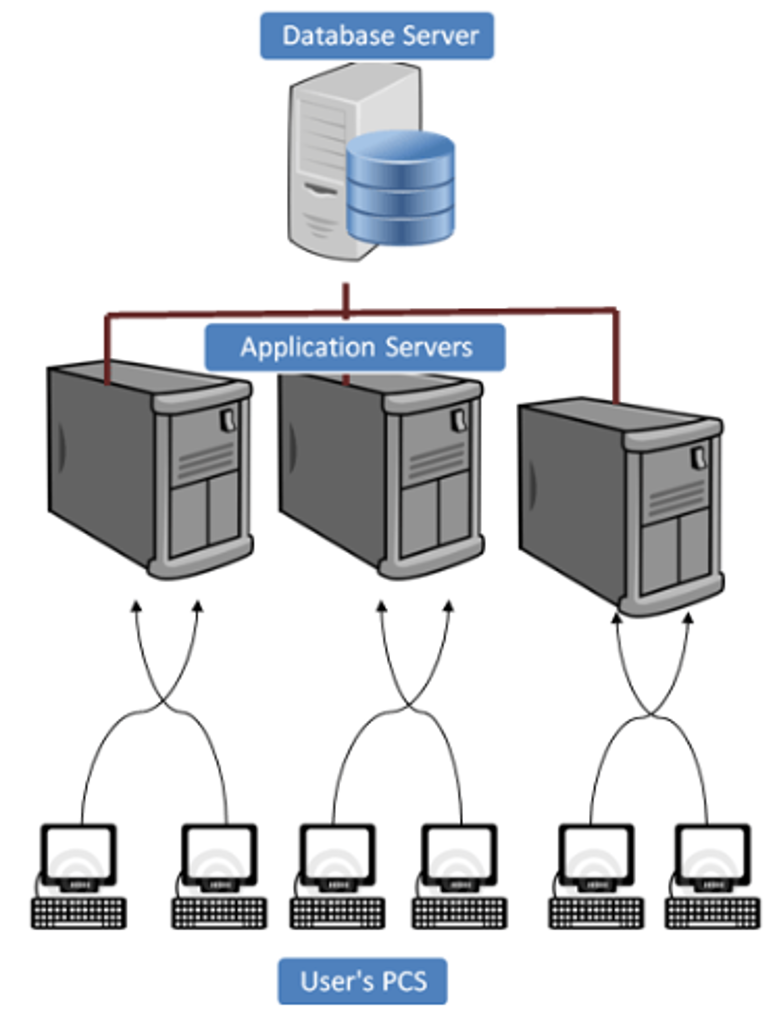
Figure 1: SAP three-tier architecture
As we drill down in the three layers, there are multiple components that are working together that need to be monitored and tuned to get the optimum end user experience.
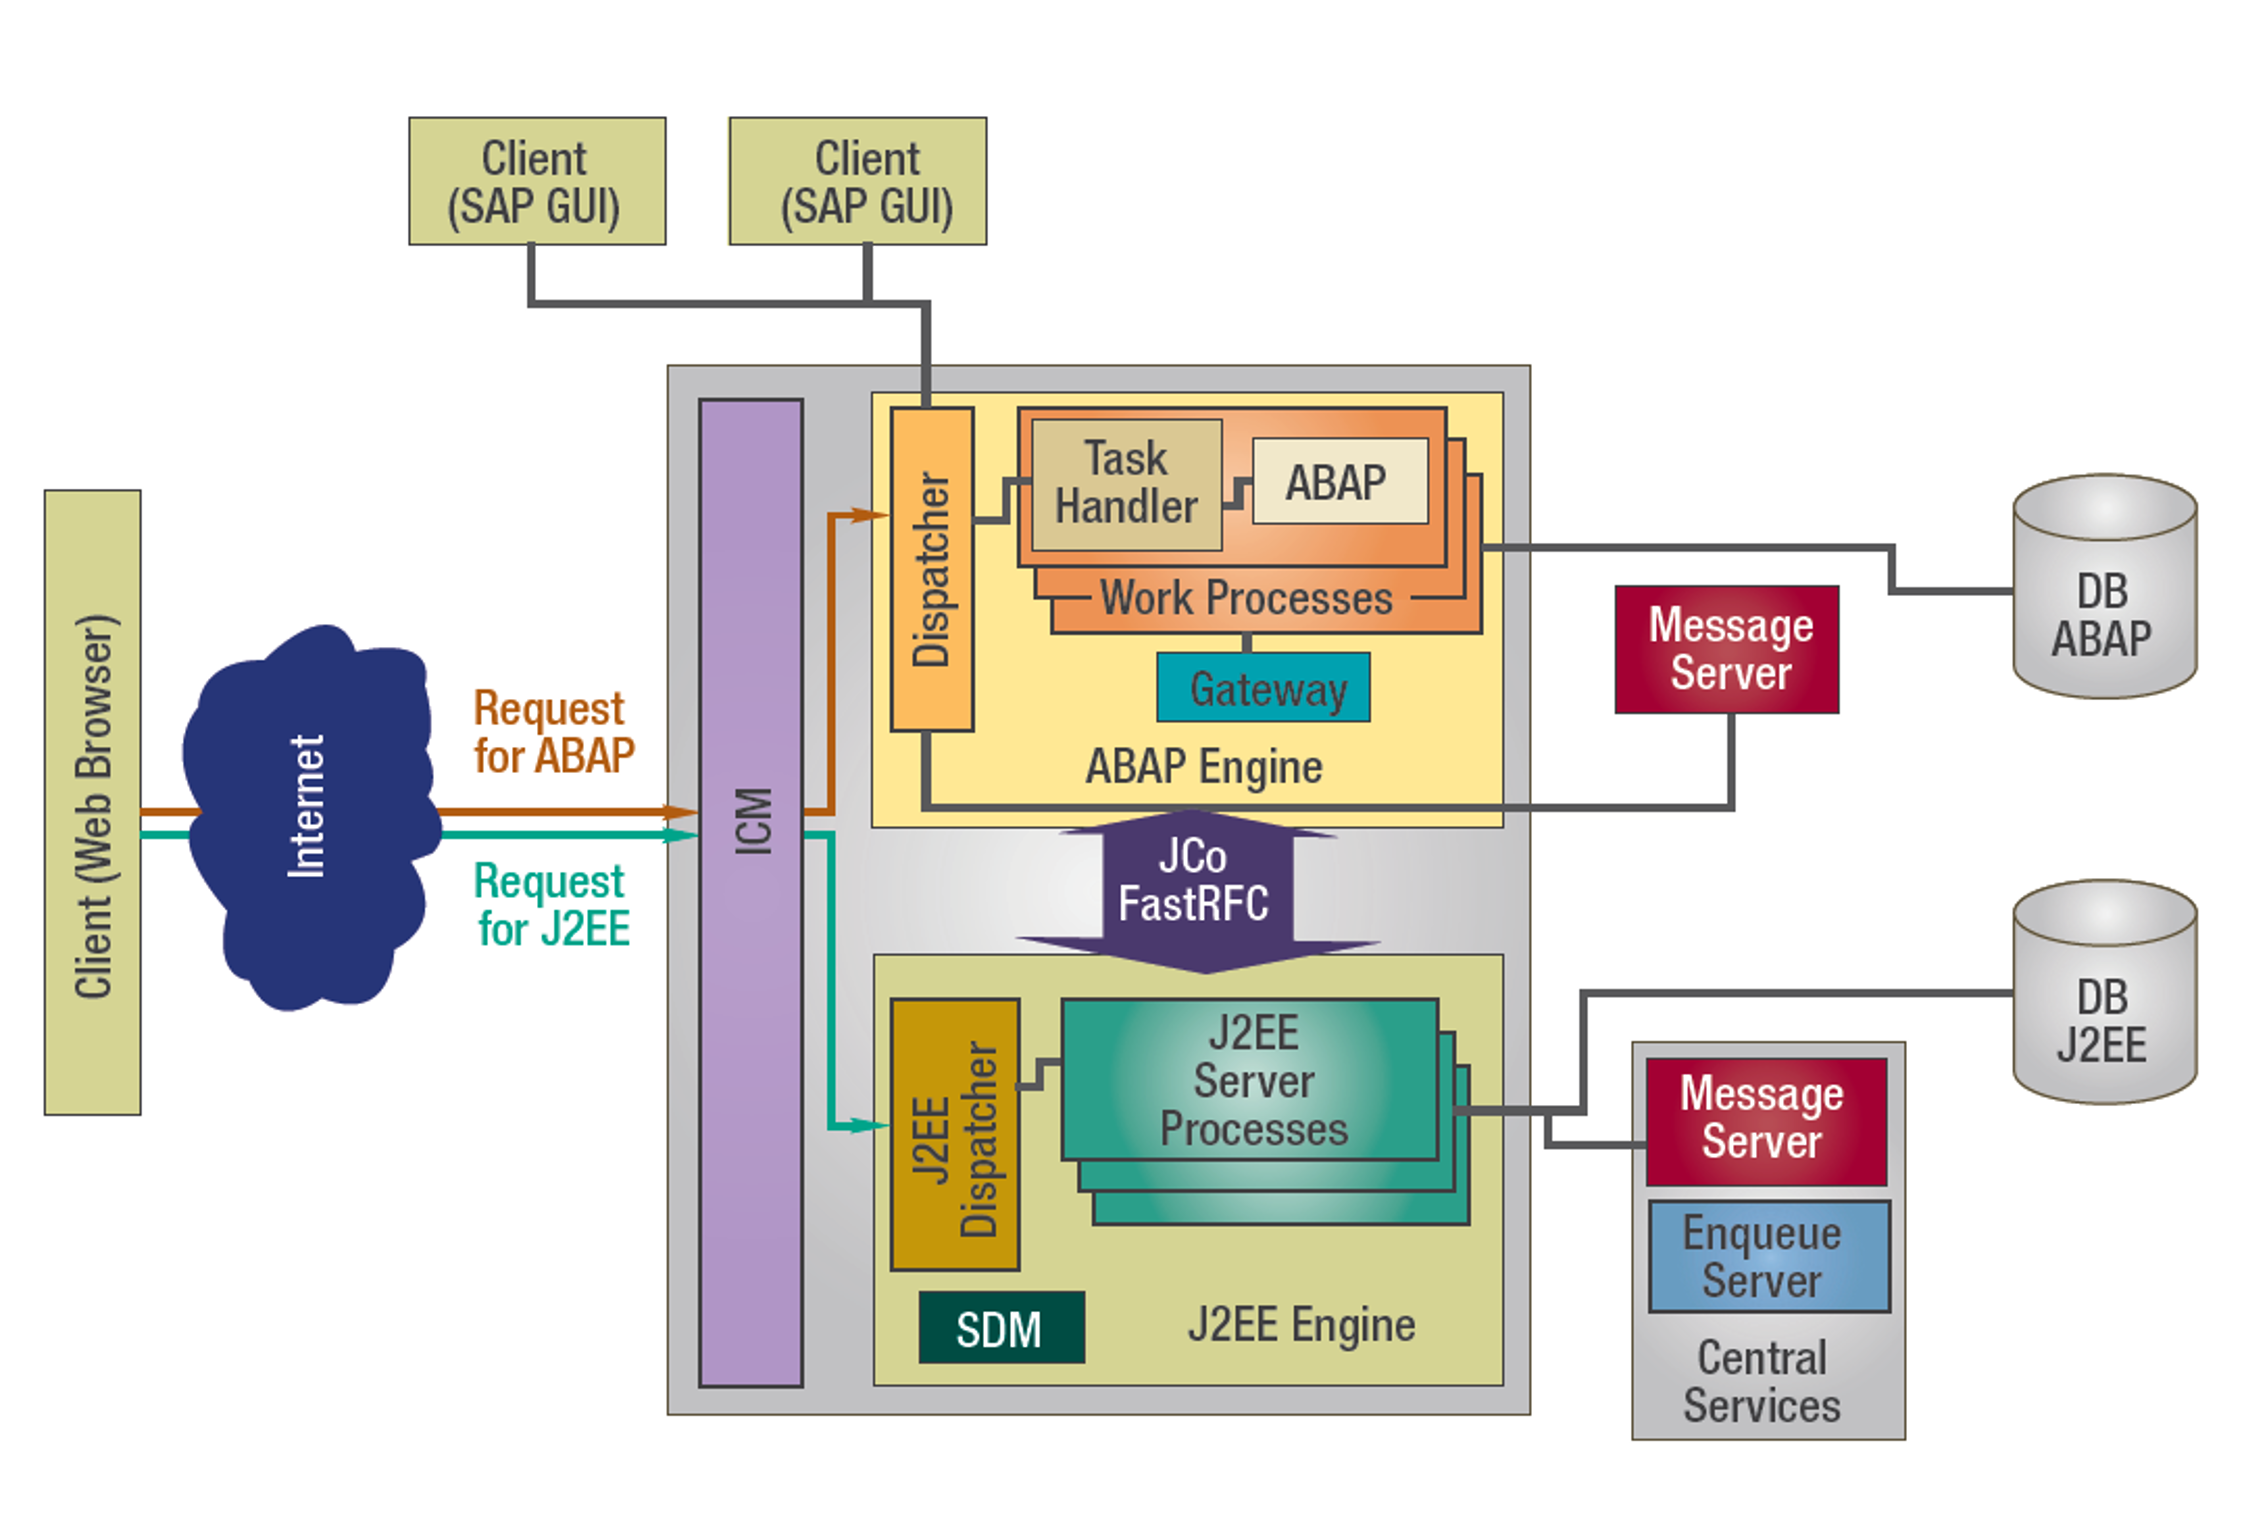
Figure 2: SAP component view
Multi-tier architectures with multiple components can introduce multiple failure points. To effectively troubleshoot issues within complex SAP environments, administrators need a comprehensive view of relevant performance metrics from across all the tiers within SAP implementations.
In monitoring SAP deployments, the IT administrator’s biggest challenge is the fact that these environments are complex, featuring several heterogenous components, all of which need to be performing optimally or business processes and the user experience can suffer. Consequently, IT administrators need clear visibility of the overall SAP deployment.
DX Unified Infrastructure Management (DX UIM) enables teams to overcome these challenges. The solution offers the following key features:
- Unified monitoring. Offers a single user interface that provides visibility into SAP ABAP, NetWeaver systems, and supporting systems like PI/PO (Process Integration/Process Orchestration), BusinessObjects (BOBJ), Hana databases, and more.
- Monitoring of on-premises and cloud deployments. Enables monitoring of on-premises SAP deployment and Hana Enterprise Cloud.
- Powerful, actionable insights. Delivers persona-specific views of performance, availability, utilization, exceptions, and usage across SAP environments.
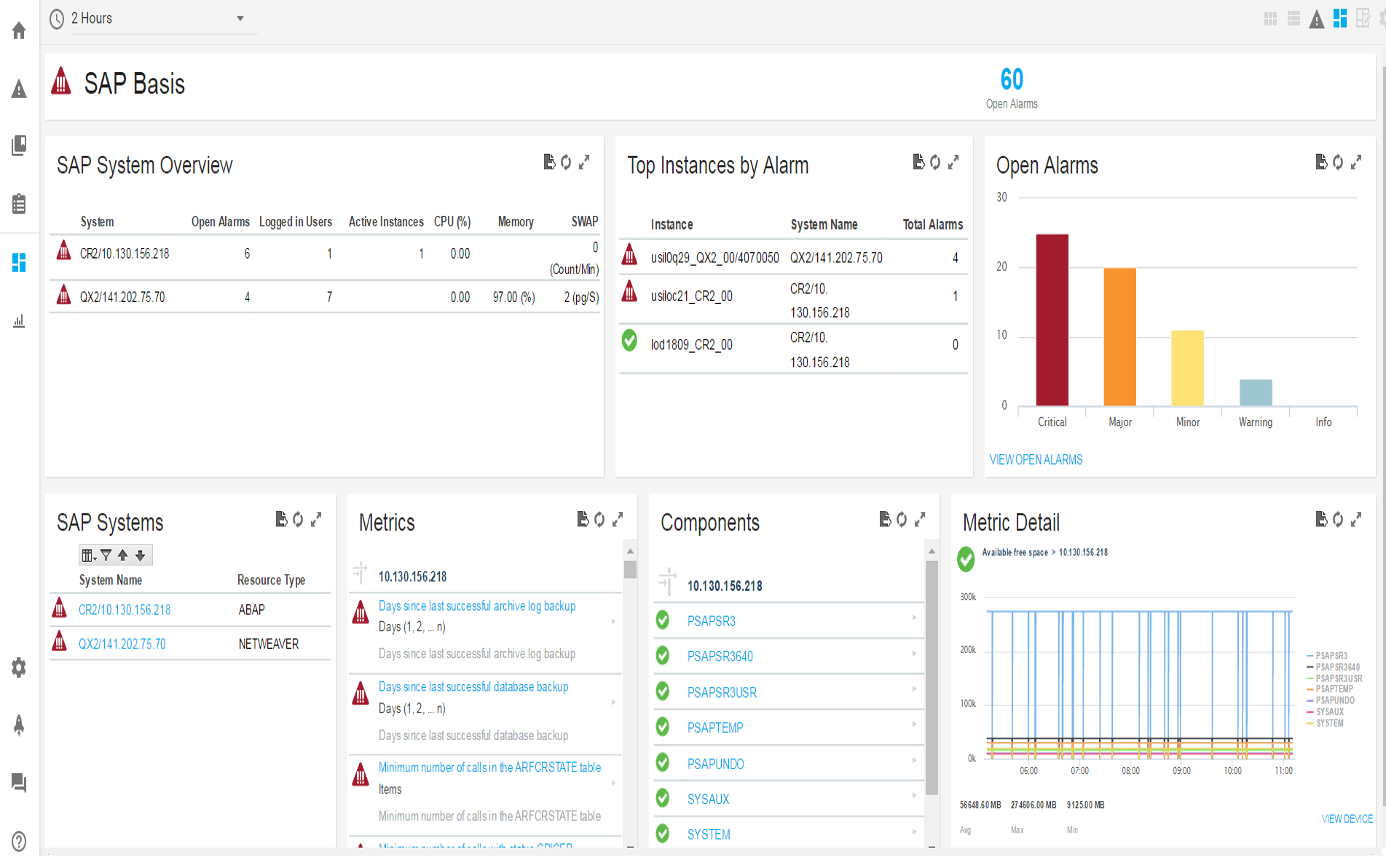
Figure 3: Modern SAP unified dashboard
For any SAP deployment, the key goal is to provide a consistent and optimized end user experience. From an infrastructure perspective, this translates to delivering acceptable response times for every user action. End user transactions are measured from the time users enter their requests to the time they receive response. This is the true measure of end-to-end response time monitoring. In ensuring optimized response times, a key success factor is ensuring that all the underlying components, both physical and virtual, are working in tandem and thereby delivering fast, reliable response times.
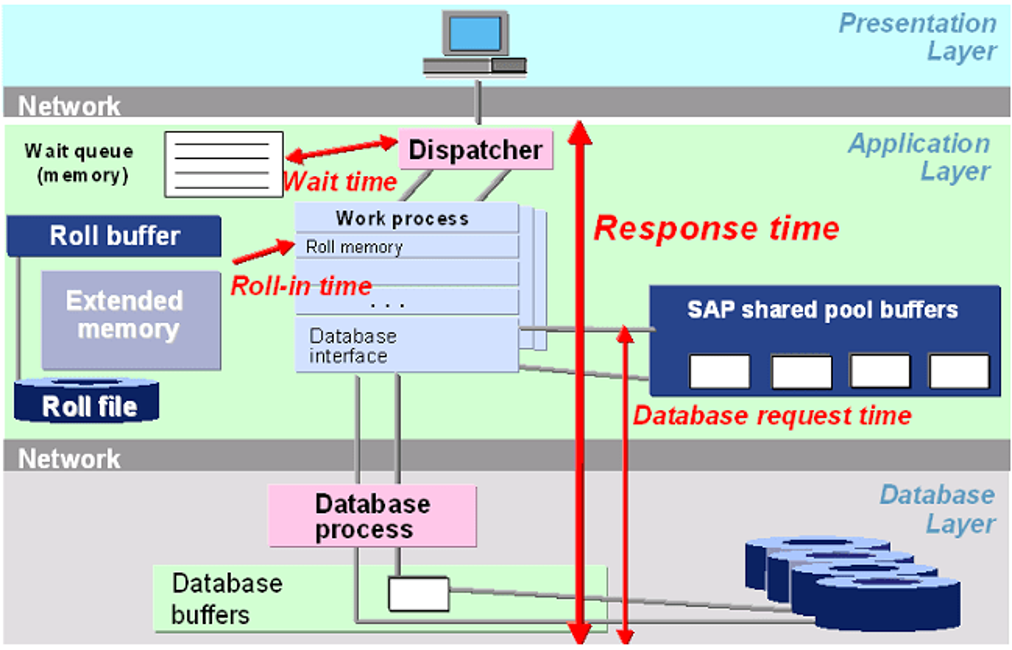
Figure 4: SAP response time monitoring
As we can see from figure 4, total response time is the sum of wait time in queue plus roll in/out time from buffer plus DB request time. Using a tool like DX UIM, you can monitor response time with out-of-the-box templates. These templates feature suggested thresholds so you can make sure the customer experience is consistently top notch.
Key SAP Metrics
| Metric | Possible Reason | QoS | Recommended Threshold |
| Response Time Front End Response Time |
Problem with any underlying component | QOS_SAP_WORKLOAD_RESPONSE_TIME QOS_SAP_WORKLOAD_DB_FRONT_END_ RESP_TIME |
< 1200ms |
| Wait Time | Problem with work process sizing | QOS_SAP_SPOOL_REQ_WAIT_TIME QOS_SAP_SPOOL_SERVICE_WAIT_TIME |
10% average response time |
| Roll Time | Can be a problem with network and RFC connections | QOS_SAP_WORKLOAD_ROLL_TIME | < 200 ms |
| DB Request Time | Can be a problem with expensive SQL statements, missing indexes, CPU / memory bottle necks and database server | QOS_SAP_WORKLOAD_DB_REQUEST_ TIME |
< 40% of average response time – wait time |
| Average Usage | Can be a problem with processing large tables and frequently accessing R/3 buffers | QOS_SAP_AS_CPU_UTILIZATION | < 40% of average response time – wait time |
| Average MS Process Time | CPU bottle necks, network problem and common problems | QOS_SAP_KERNEL_AVG_MS_PROCESS_ TIME |
~ CPU Time |
If the goal is to provide the best user experience, a tool like DX UIM can be invaluable. The solution can monitor SAP deployments, whether running on-premises or in the Hana Enterprise Cloud. In DX UIM, monitoring is done using lightweight agents called probes. Among the solution’s more than 140 probes, DX UIM features the sap_basis probe for SAP environments. This probe gets non-synthetic monitoring data from SAP-approved connectors and exposed web services. DX UIM offers the following key advantages:
- Comprehensive coverage. Track relevant performance metrics from across all the tiers and infrastructure elements in an SAP environment.
- Out-of-the-box templates and dashboards. Gain the capabilities you need to quickly and easily monitor SAP ABAP, SAP HANA, and SAP NetWeaver.
- SLA and trend reports. Monitor historical data to find the root cause of issues and better plan for future needs.
- Data security and regulatory compliance. Use DX UIM to connect to the SAP system with a dedicated SAP authorization profile, so you can guard against unauthorized access to business data.
Now, it is critical to have a unified perspective of the performance and availability status of all SAP components in the deployment, whether on premises or in the cloud. DX UIM addresses this demand. Part of Broadcom’s AIOps and observability solutions, DX UIM helps enterprise IT operations teams monitor their multi-tier, heterogenous IT footprints, from the application to the infrastructure level. The solution provides the holistic and contextual view of IT deployments that enable teams to do full-stack, digital experience monitoring and deliver five-star experiences.
For more infrastructure management resources, see our DX UIM home page on Broadcom’s Enterprise Software Academy.